Copilot Insight Engine (CIE)
CIE is an analytics tool for Copilot (Chat & Search), which enables everyone to conduct in-depth data analysis and track what matters to your team for data-driven decision-making.
MVP Design | Iteration Design | UI Kit Builder | ...
MVP Design
Building the Foundation
As the sole designer for the LT Dashboard (formerly part of the MSAI data platform), I independently led the team's early transition from a Power BI–based dashboard to a web-based data tool. From the ground up, I created the initial version of CIE, laying the foundation for future development through early design exploration and experimentation.
Early 2025
Context
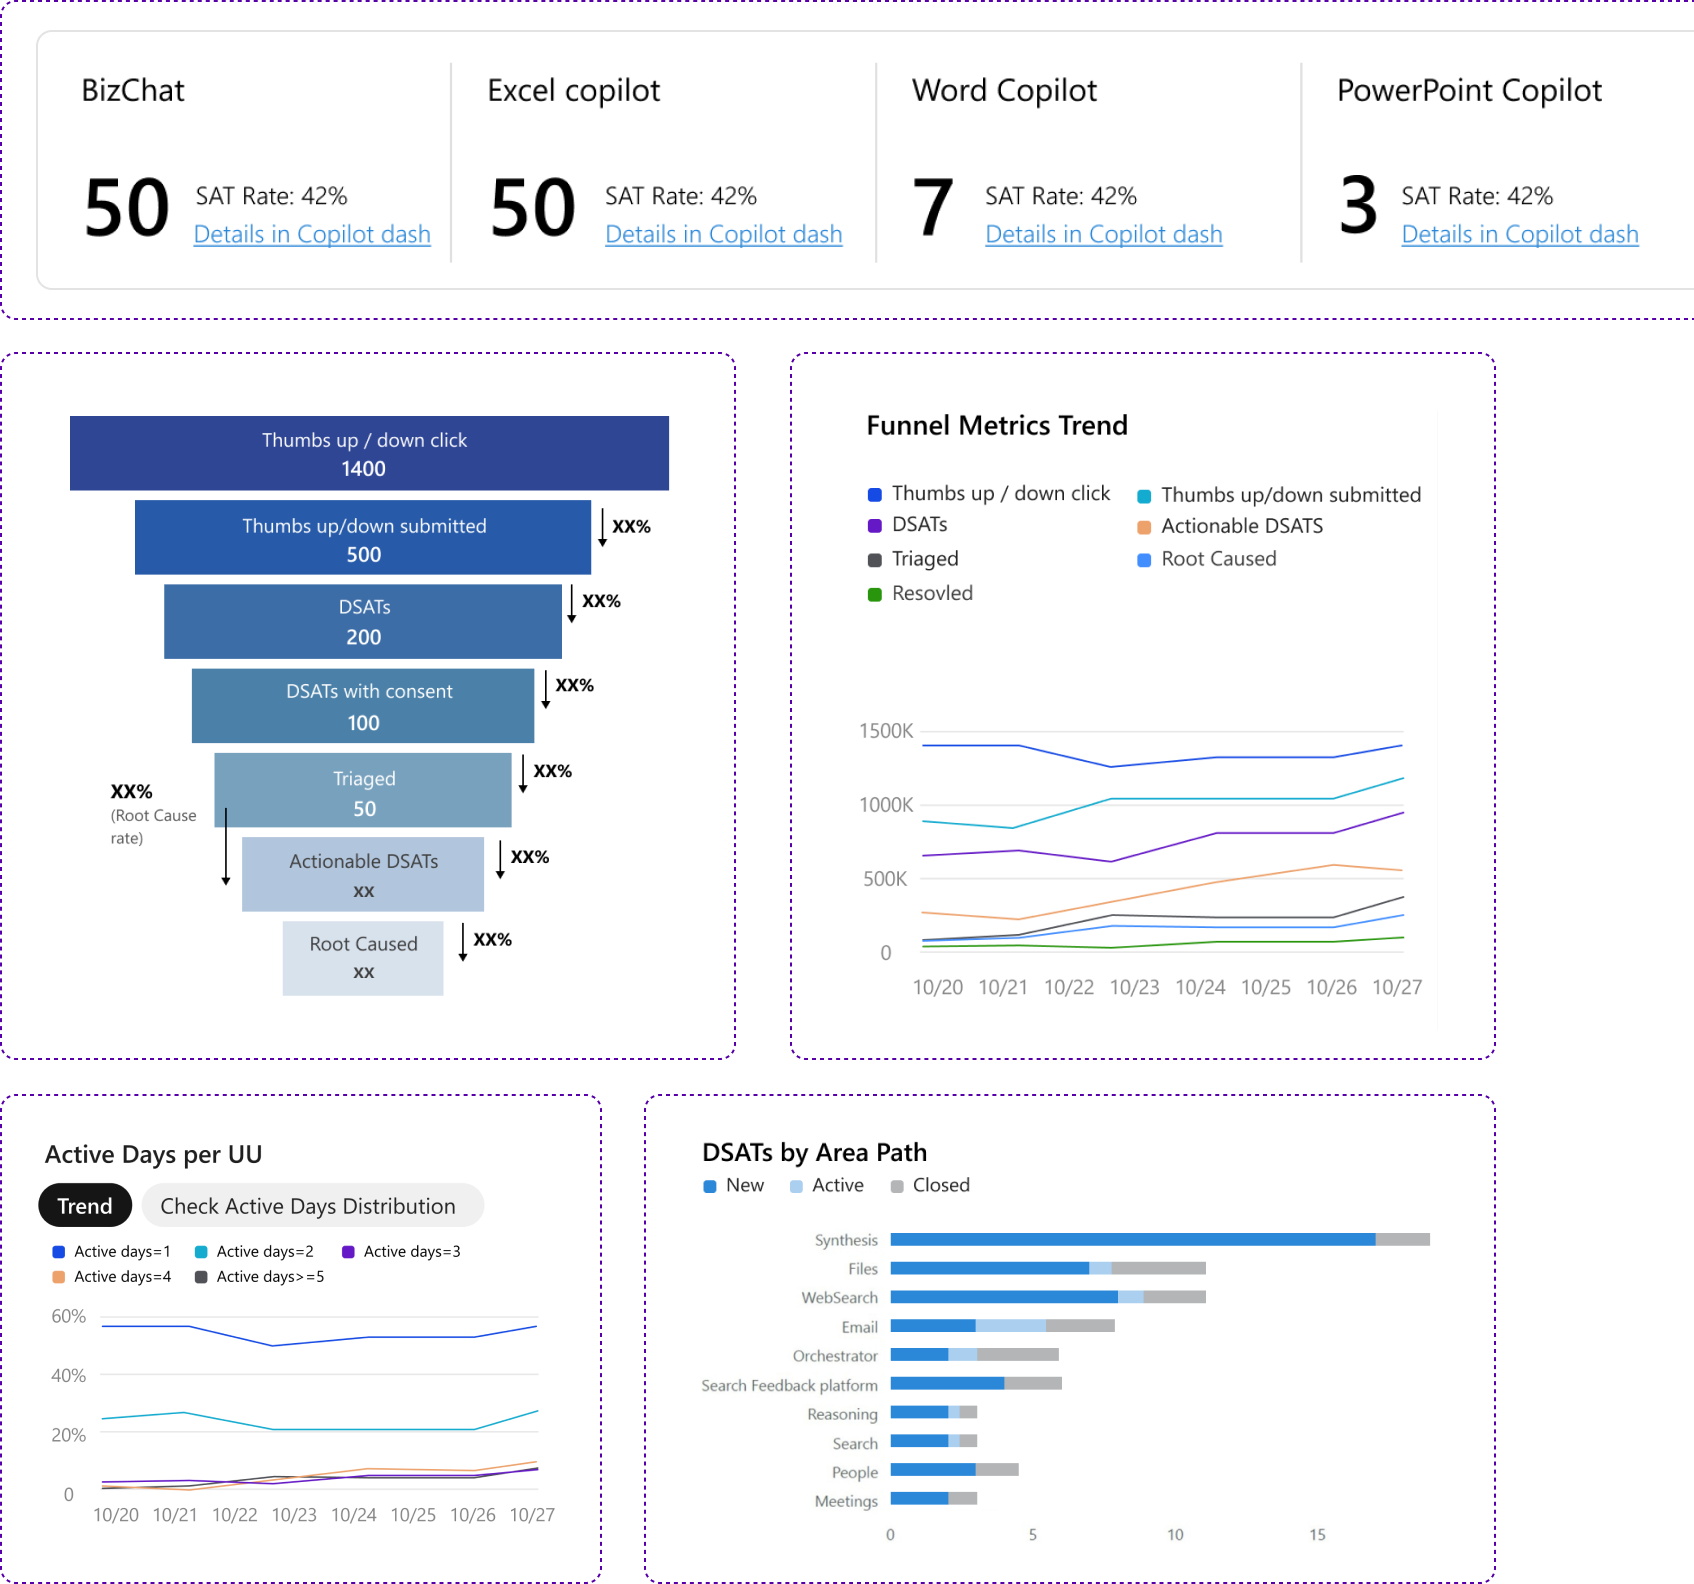
Data analytics is the foundation for understanding user behavior and evaluating Copilot's performance. Before CIE, teams relied on Power BI dashboards as the primary tool for Copilot data analysis.
👍👍👍 Strong analytical and technical capability
- •100+ metrics & 60+ L1 slicers
- •Various visualized charts
- •Ensuring readability and clarity through thoughtful visual and layout design
Motivation
As our data capabilities expanded, the number of available metrics and slicers grew significantly. The dashboard format could no longer effectively represent the results of all possible combinations between metrics and slicers, limiting users' ability to explore and compare data comprehensively.
We aim to create a flexible analytics platform experience that enables dynamic comparison, deeper exploration, and actionable insights from Copilot data.
Design Principles
Intuitive
Everything is where it's expected to be. IA respects users who are proficient with various data analysis tools while accommodating the long-term habits of Power BI users.
Scalable
Build a robust, modular framework that accommodates expanding data and features without clutter.
Efficient
Empower users with seamless CRUD (Create, Read, Update, Delete) capabilities and lightweight interactions to maximize productivity.
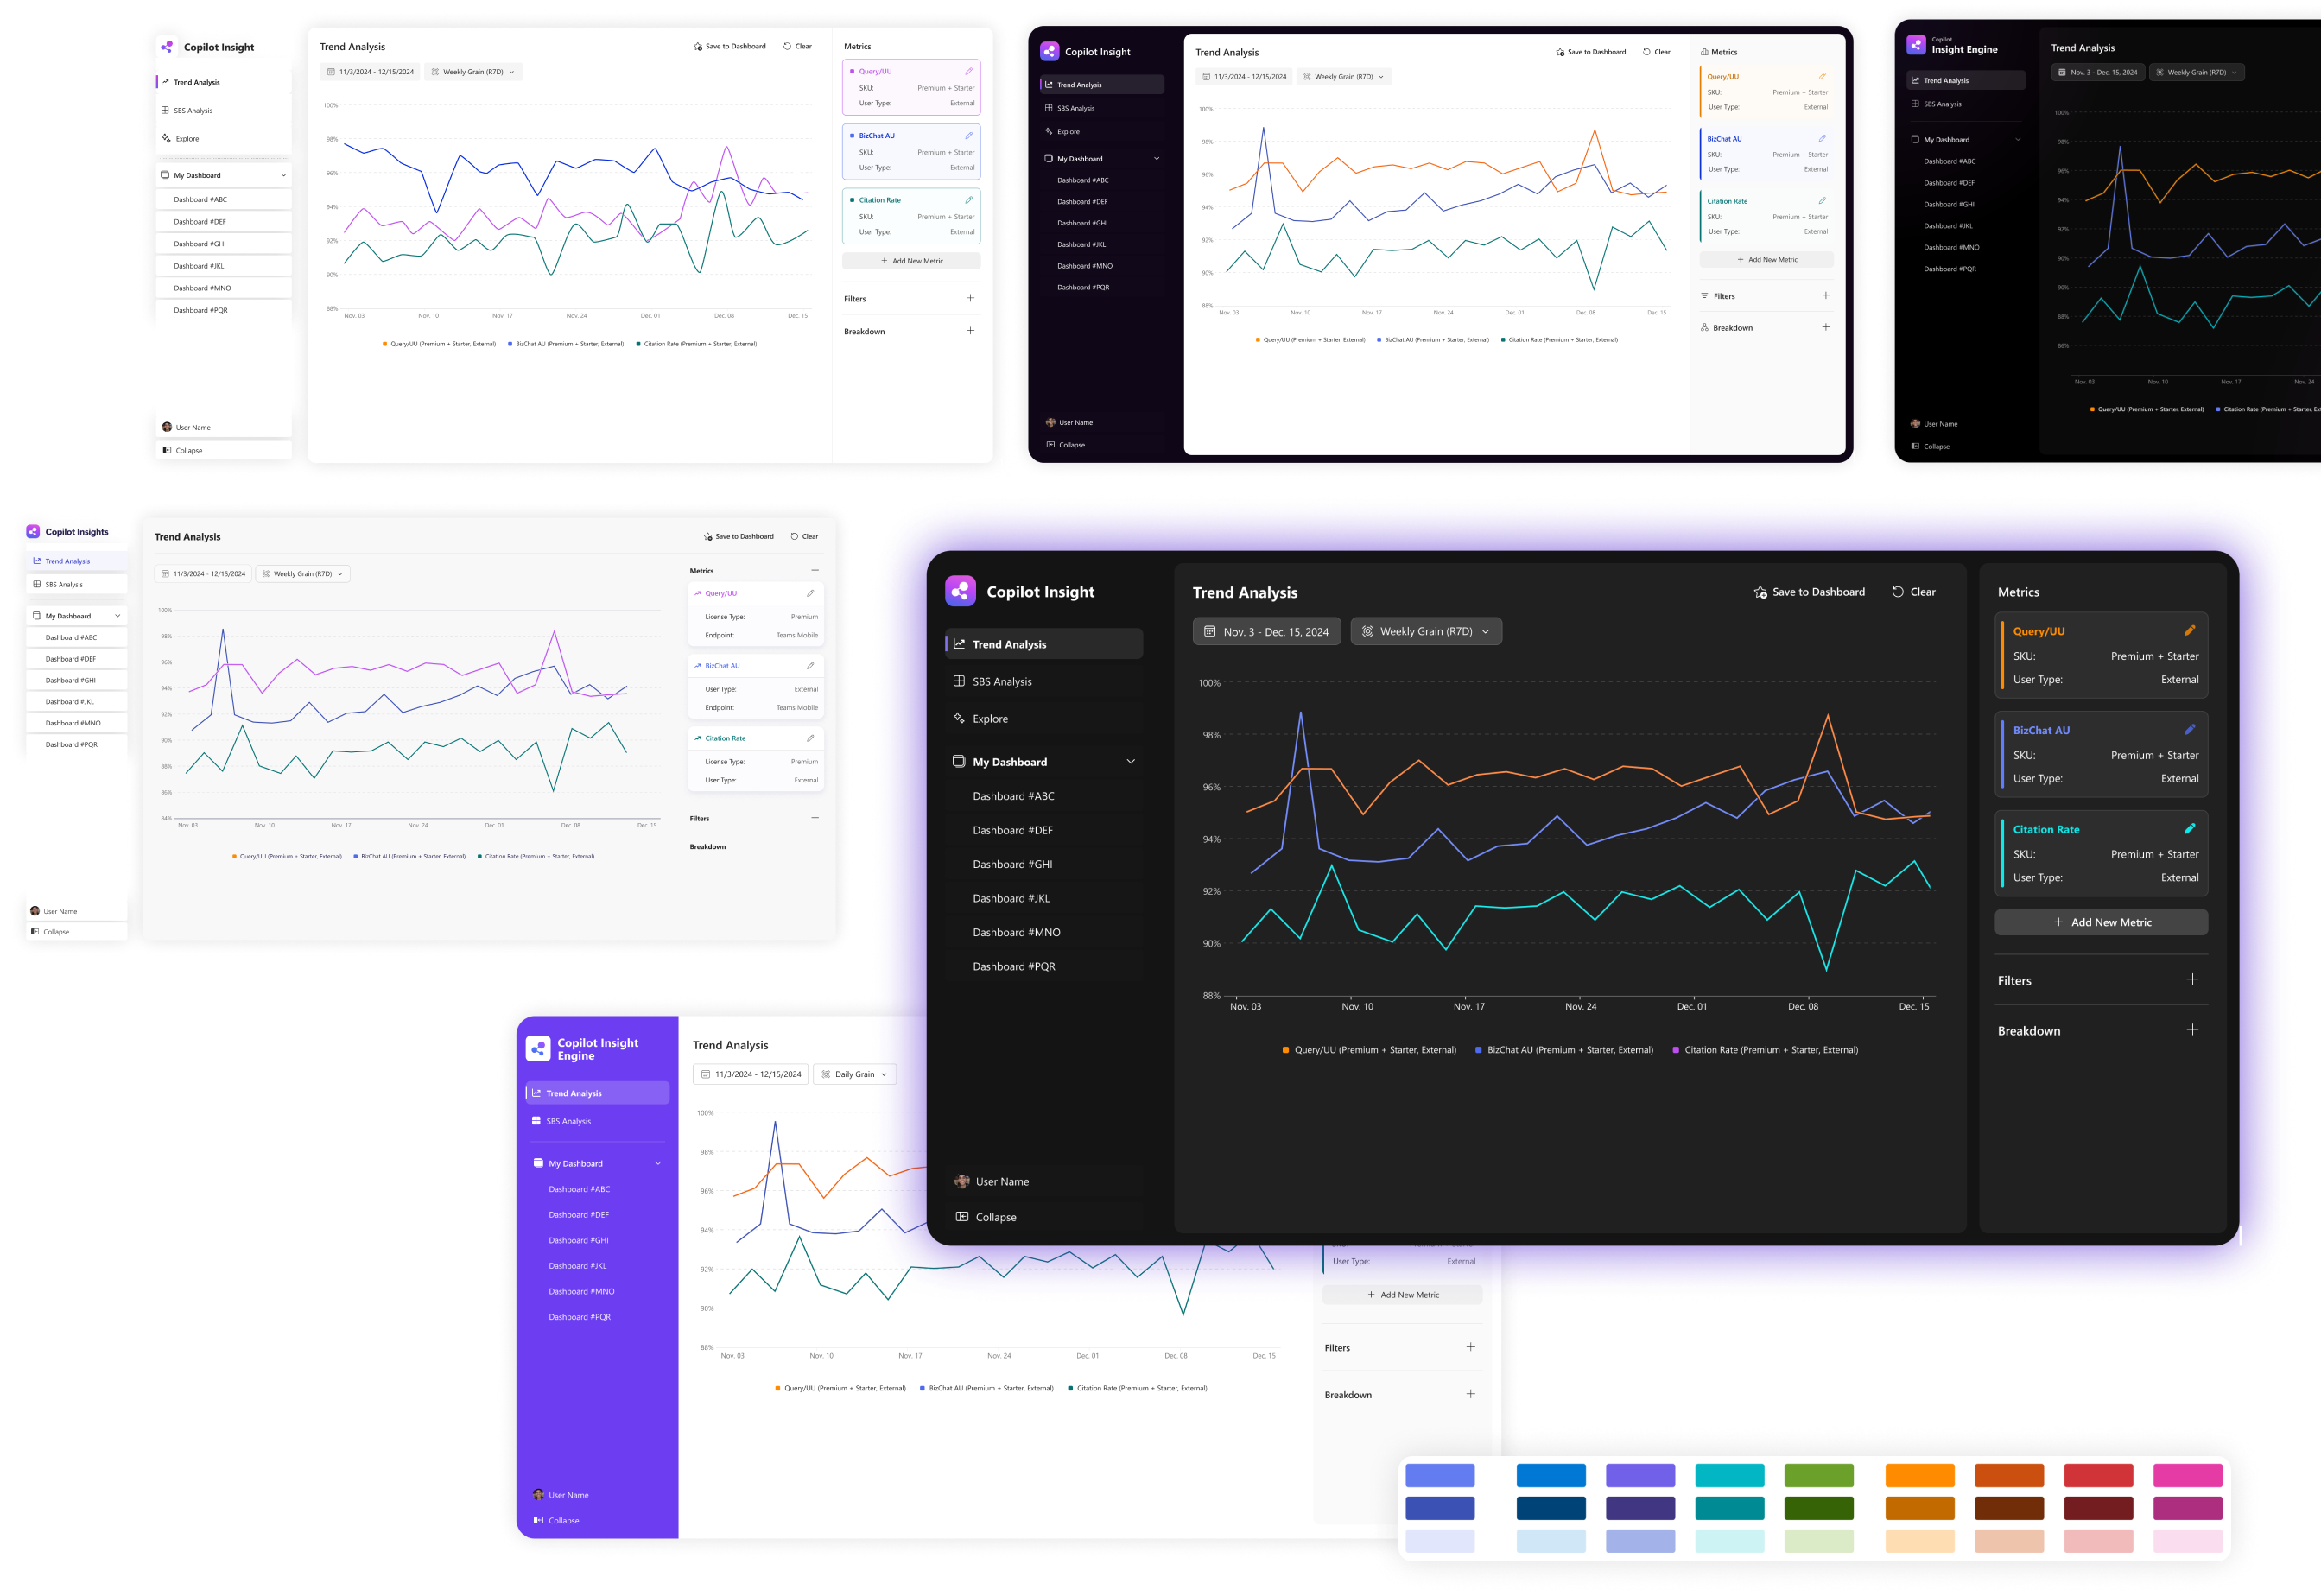
Define the IA

Design Showcase
Dark Mode as example
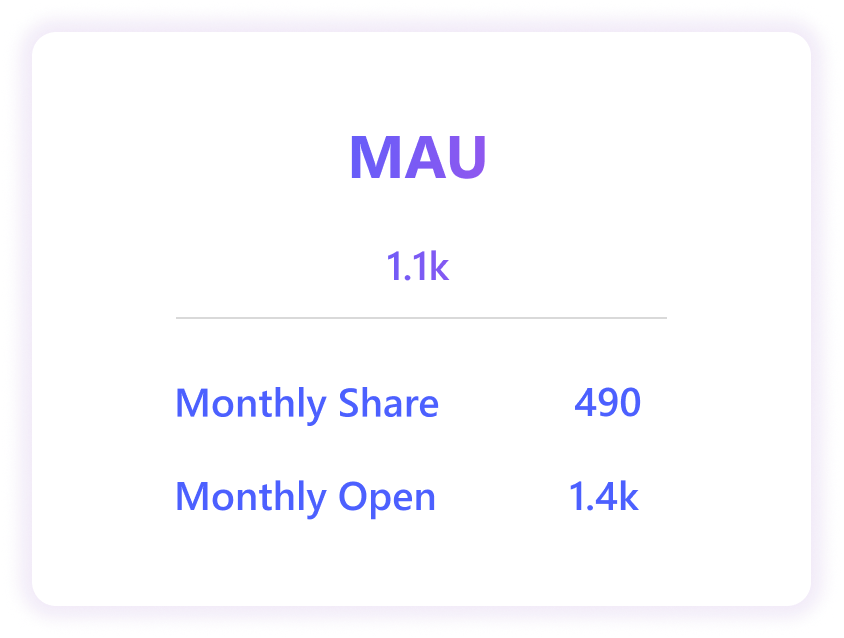
MVP Success Highlights
- •Internal Adoption & Stickiness: Scaled rapidly within the BizChat Mobile group; sustained high active user ratios across multi-disciplinary teams (PM, Dev, Design), proving the product's daily utility.
- •Executive Advocacy: Recognized and championed by CVP-level leadership, leading to direct organizational endorsements and a strategic push for cross-org implementation.
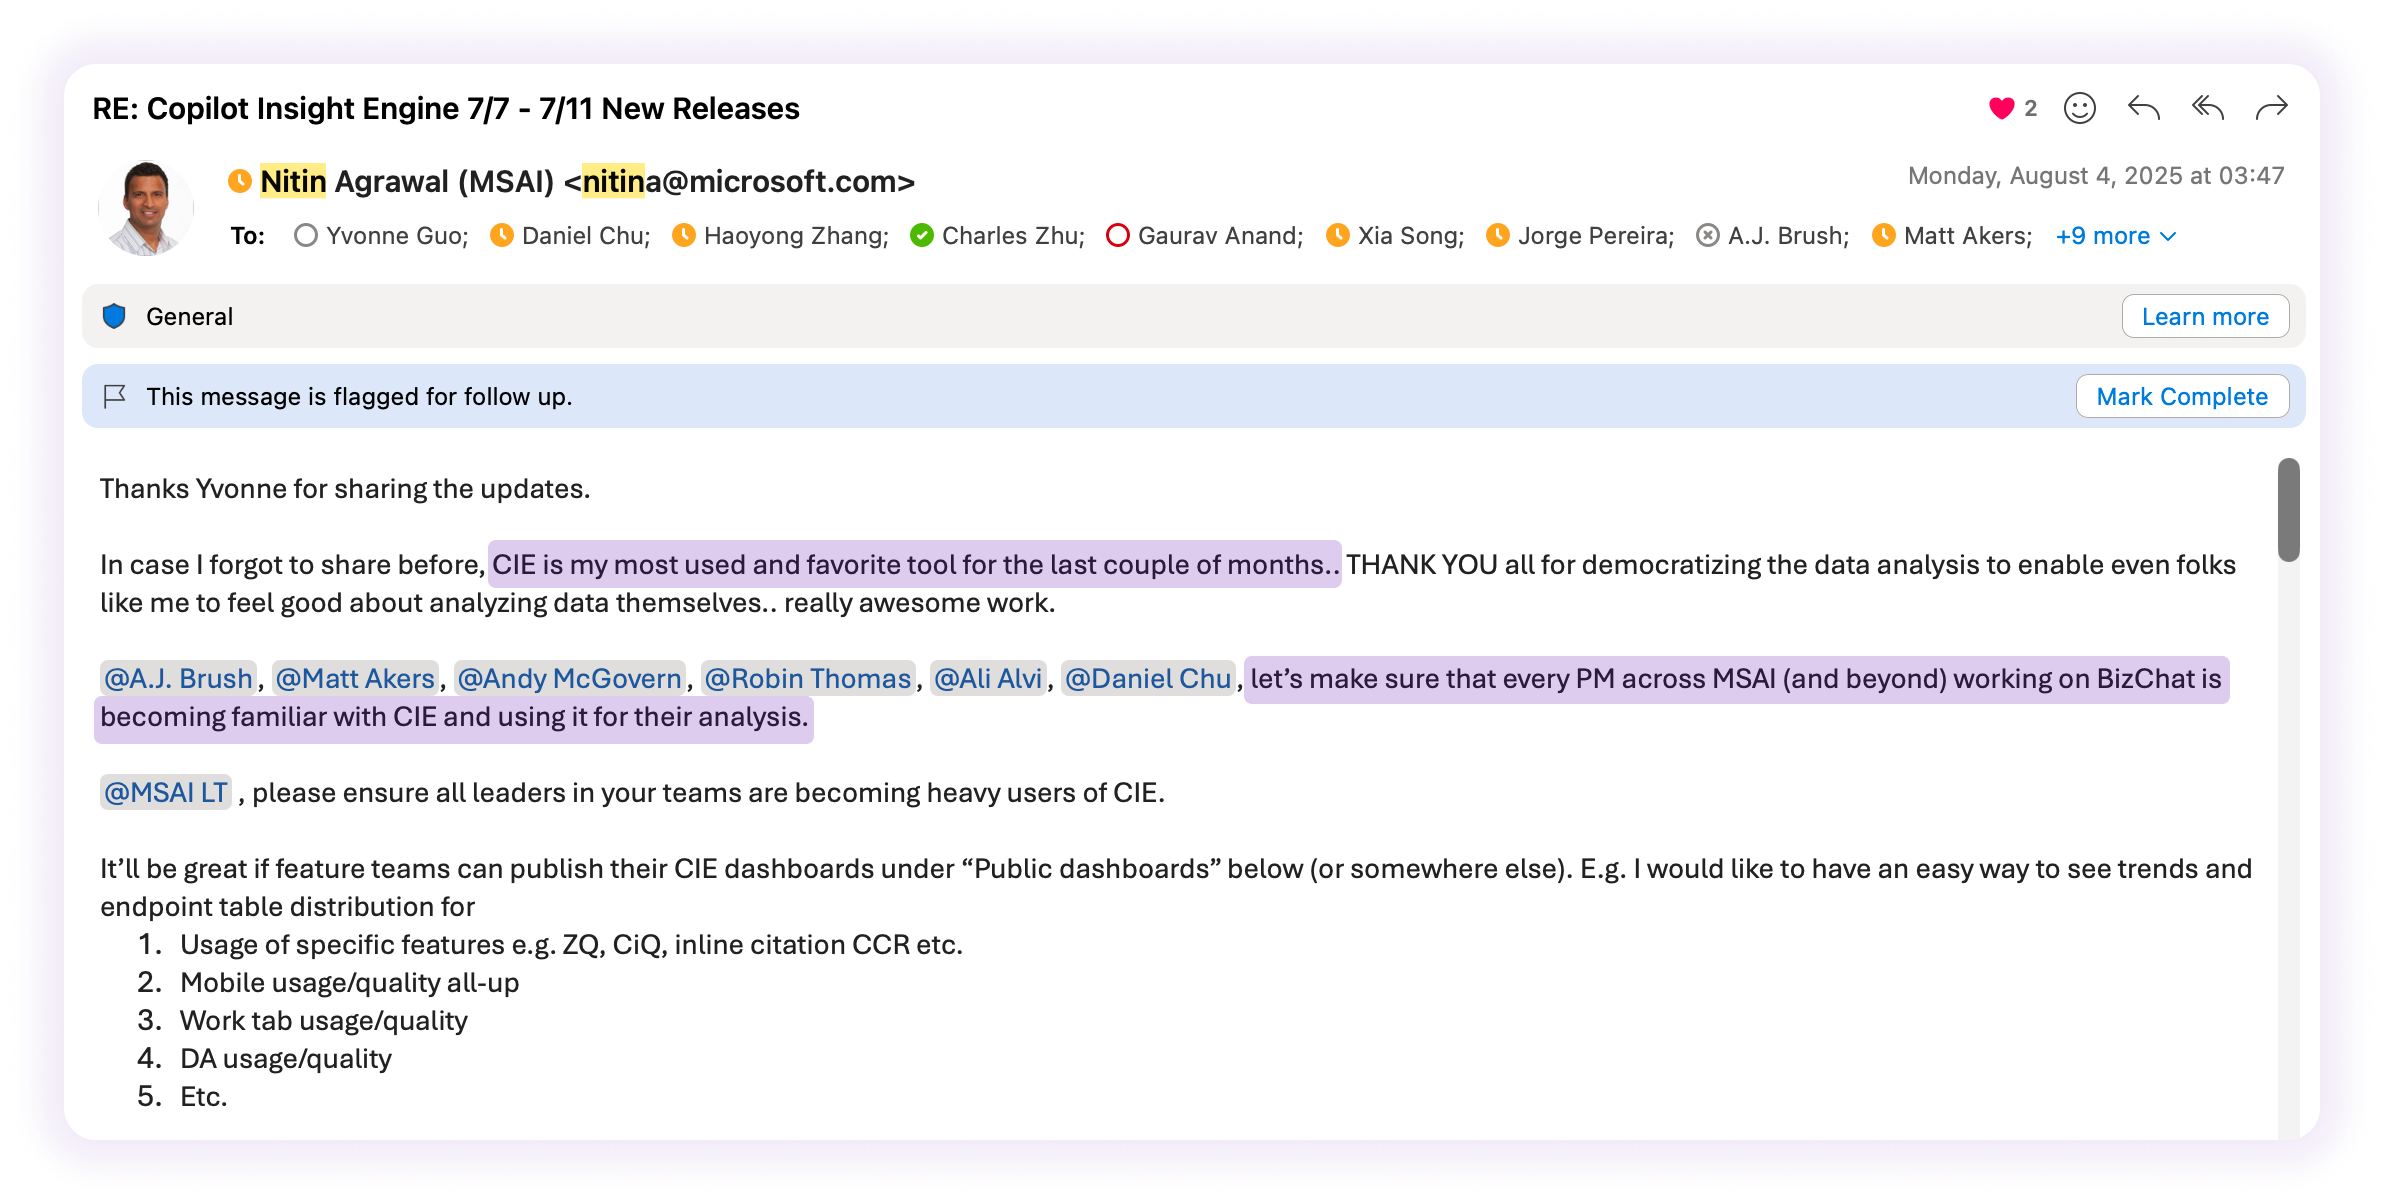
Feedback
Gather feedback on the MVP version, from both PMs outside the Data Team as fresh eyes and power users of CIE with high usage frequency and duration.
Readability & Visual Clutter
Overlapping tooltips and small thumbnails hide essential trends, making it hard to identify key data.
Efficiency & Flexibility
The lack of a "sandbox" for risk-free debugging and repetitive manual steps create significant friction.
Management & Maintenance
Maintaining workspaces is labor-intensive due to the absence of intuitive reordering and batch editing.
Collaboration & Mental Model
Unclear save behaviors and forced dashboard injections create psychological uncertainty for users.
HMW
- •Streamline the diagnostic process to reduce interaction cost?
- •Provide a safe "playground" for users to experiment with data?
Metric Experience
Continuous Improvement
Based on user feedback, I improved the MVP's user experience for creating and managing metrics, with a focus on enhancing efficiency. I also introduced new features to make metric analysis more comprehensive and flexible.
May 2025

Background
The existing Copilot Insights Engine (CIE) has laid a solid foundation by enabling users to effortlessly customize their dashboards, better track and analyze multi-product data and metrics based on diverse goals and targets across various dimensions.
It is imperative that the product delivers a more user-friendly and seamless experience. This will empower product owners to build their dashboards with minimal effort, requiring just a few clicks.
Problem Statement
Struggle on create and distinguish metrics with similar configurations
Users need to add each single metric manually even for similar definitions, which costs user time.
Misinterpretation of metrics and slicers
Users often struggle to understand what a metric actually represents. This lack of clarity leads to misinterpretation of data and incorrect conclusions.
Not efficient or intuitive enough
The overlay with side panel design makes the experience of creating/editing configurations appear overly cumbersome and less fluid.
Exploration
Delivering a unified hub for faster, more accessible metric configuration.
Pros
- •Centralized Slicing: A unified workspace for adding and managing metric slicers.
- •Inline Efficiency: Lightweight inline editing for slicer values to minimize interaction cost.
- •Intelligent Setup: A high-focus dialog featuring full CRUD and real-time previews to flag technical limitations or data discrepancies instantly.
Cons
- •Workflow Disruption: Overlays visually break the user's immersion and focus on canvas content.
- •Spatial Fragmentation: The spatial gap between the top-right entry and centered dialog causes unnecessary visual scanning. This misalignment creates a disjointed workspace experience.
Iterated Solution
Pop-over replace side panel
Support user can easily and simply create and manage their metrics cards.
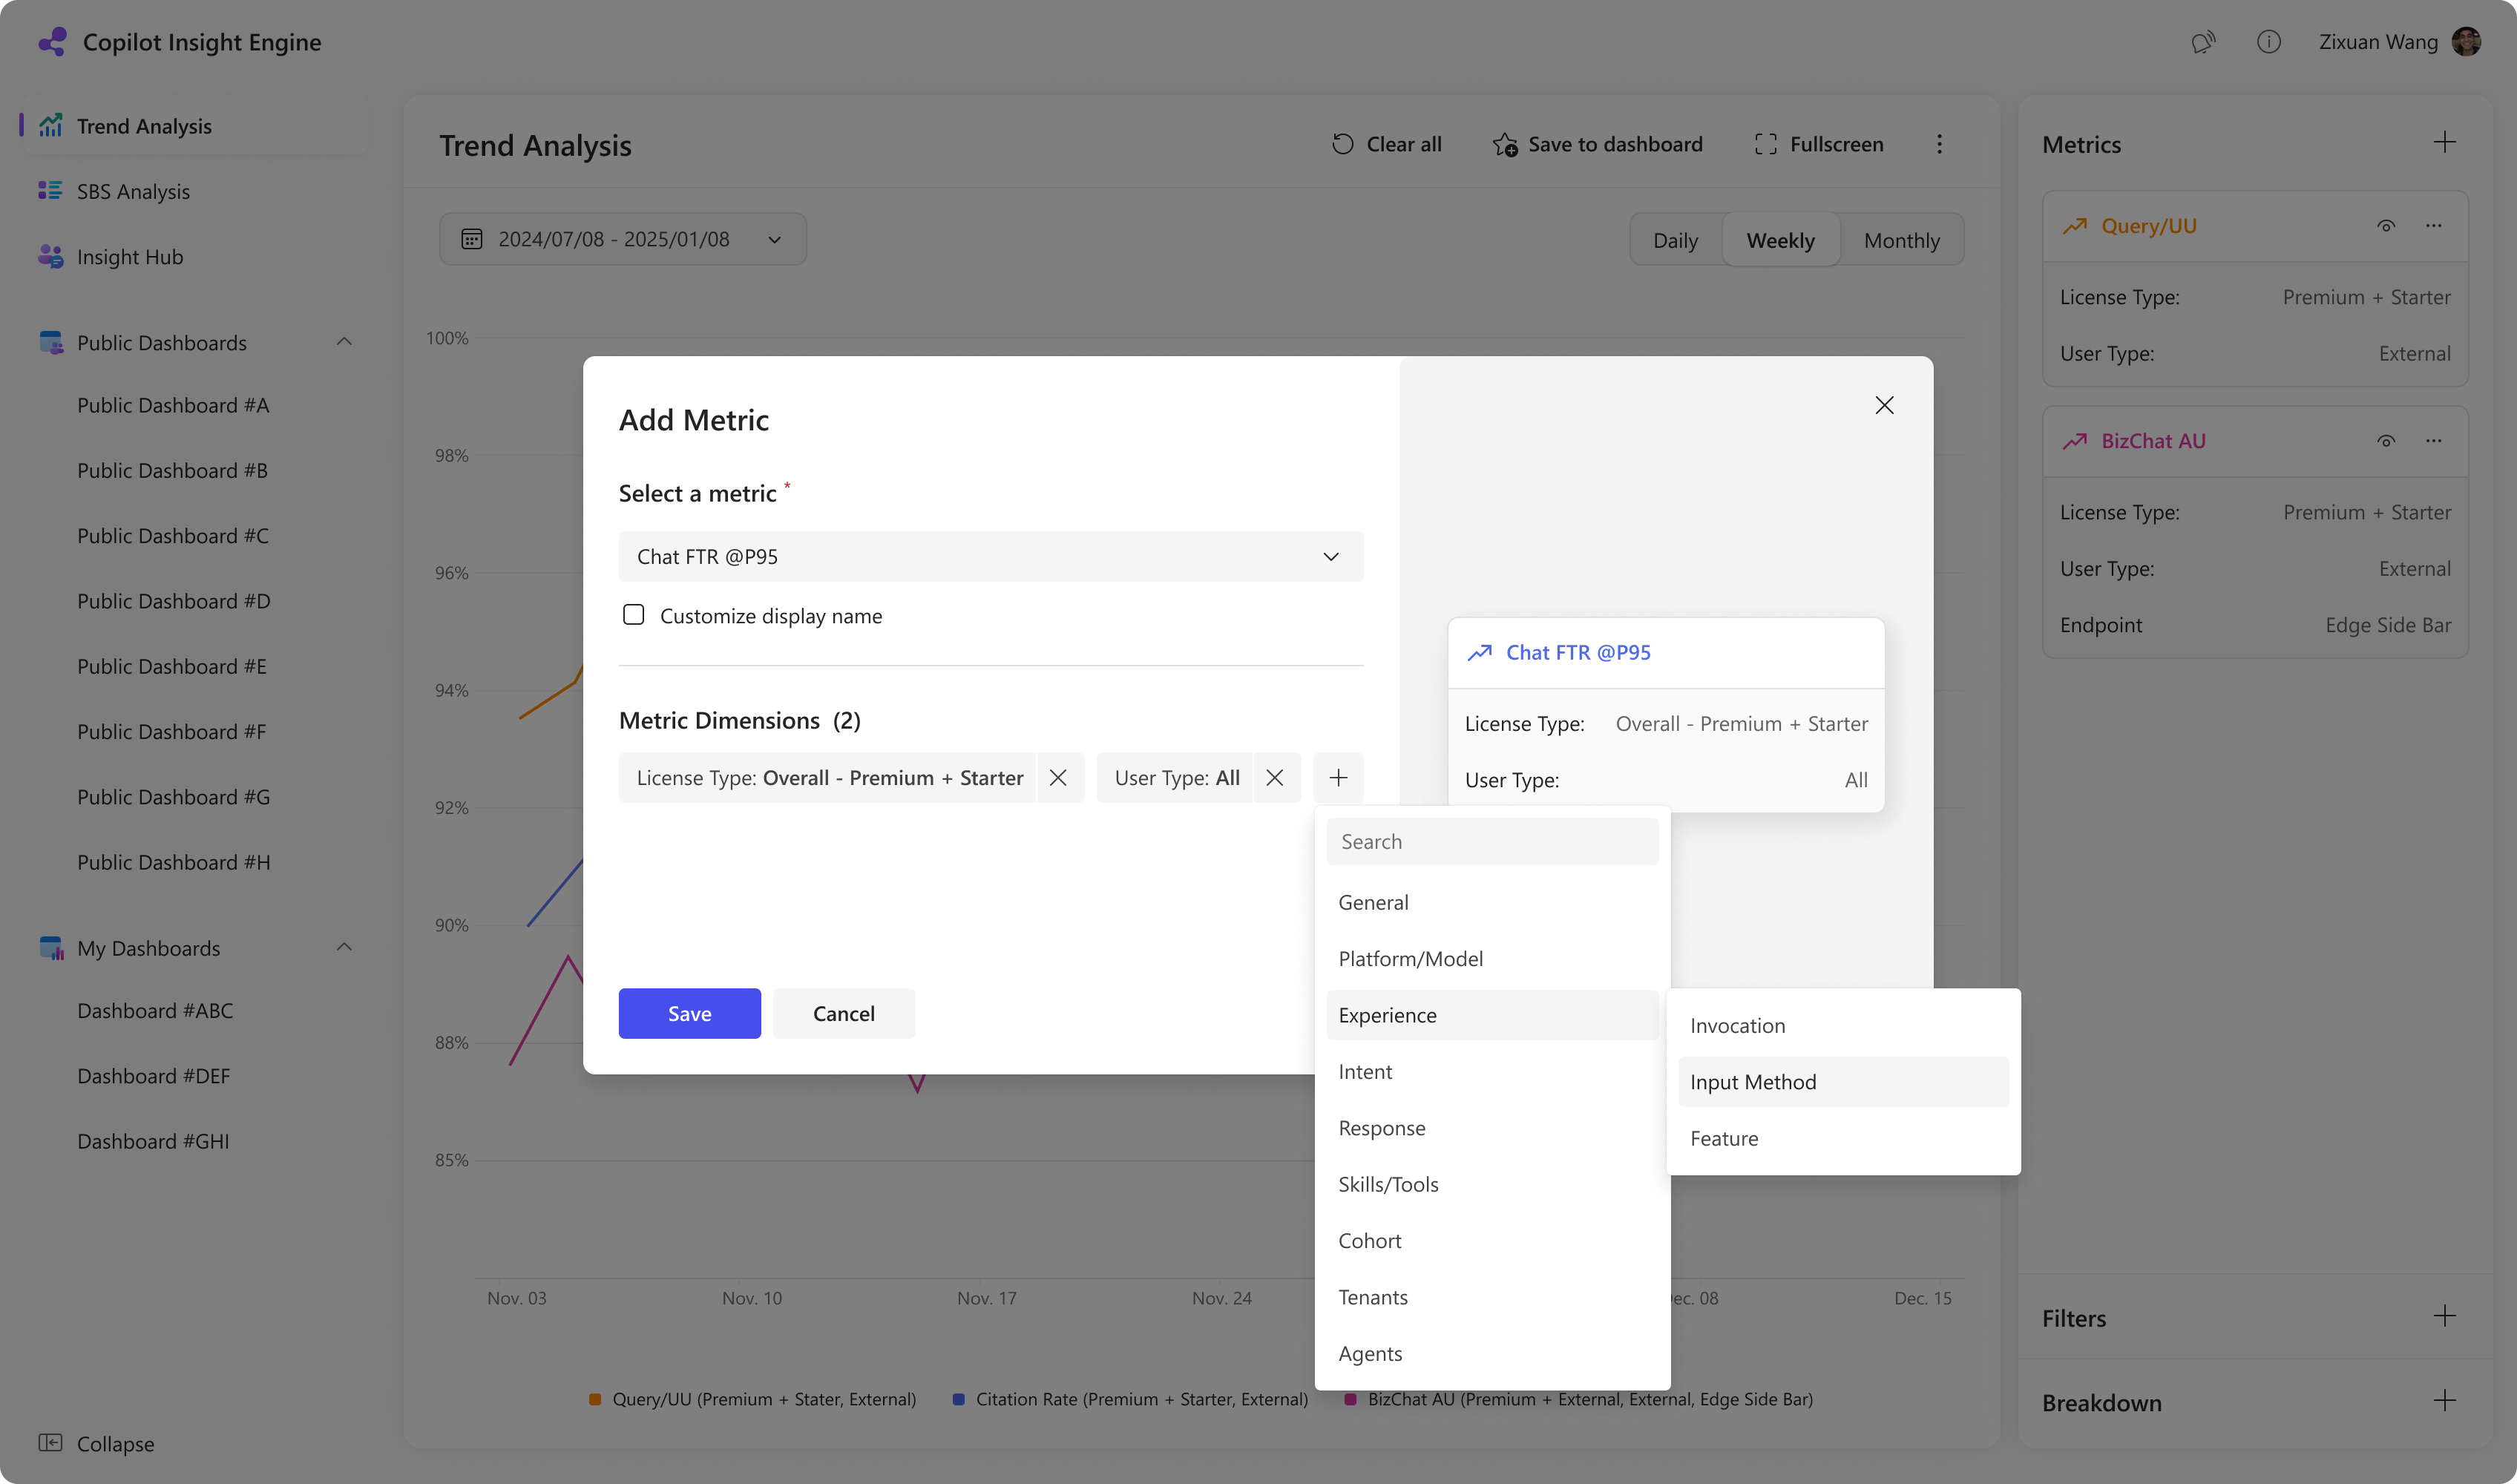
Categorize and group metrics
Support user to quickly locate the specific one from hundreds of metrics.
Inline metric definition
Reducing misinterpretation and improving confidence in chart building and dashboard consumption.
Customize name & Duplicate metric card
Quickly manage and create metric cards with personalized settings.
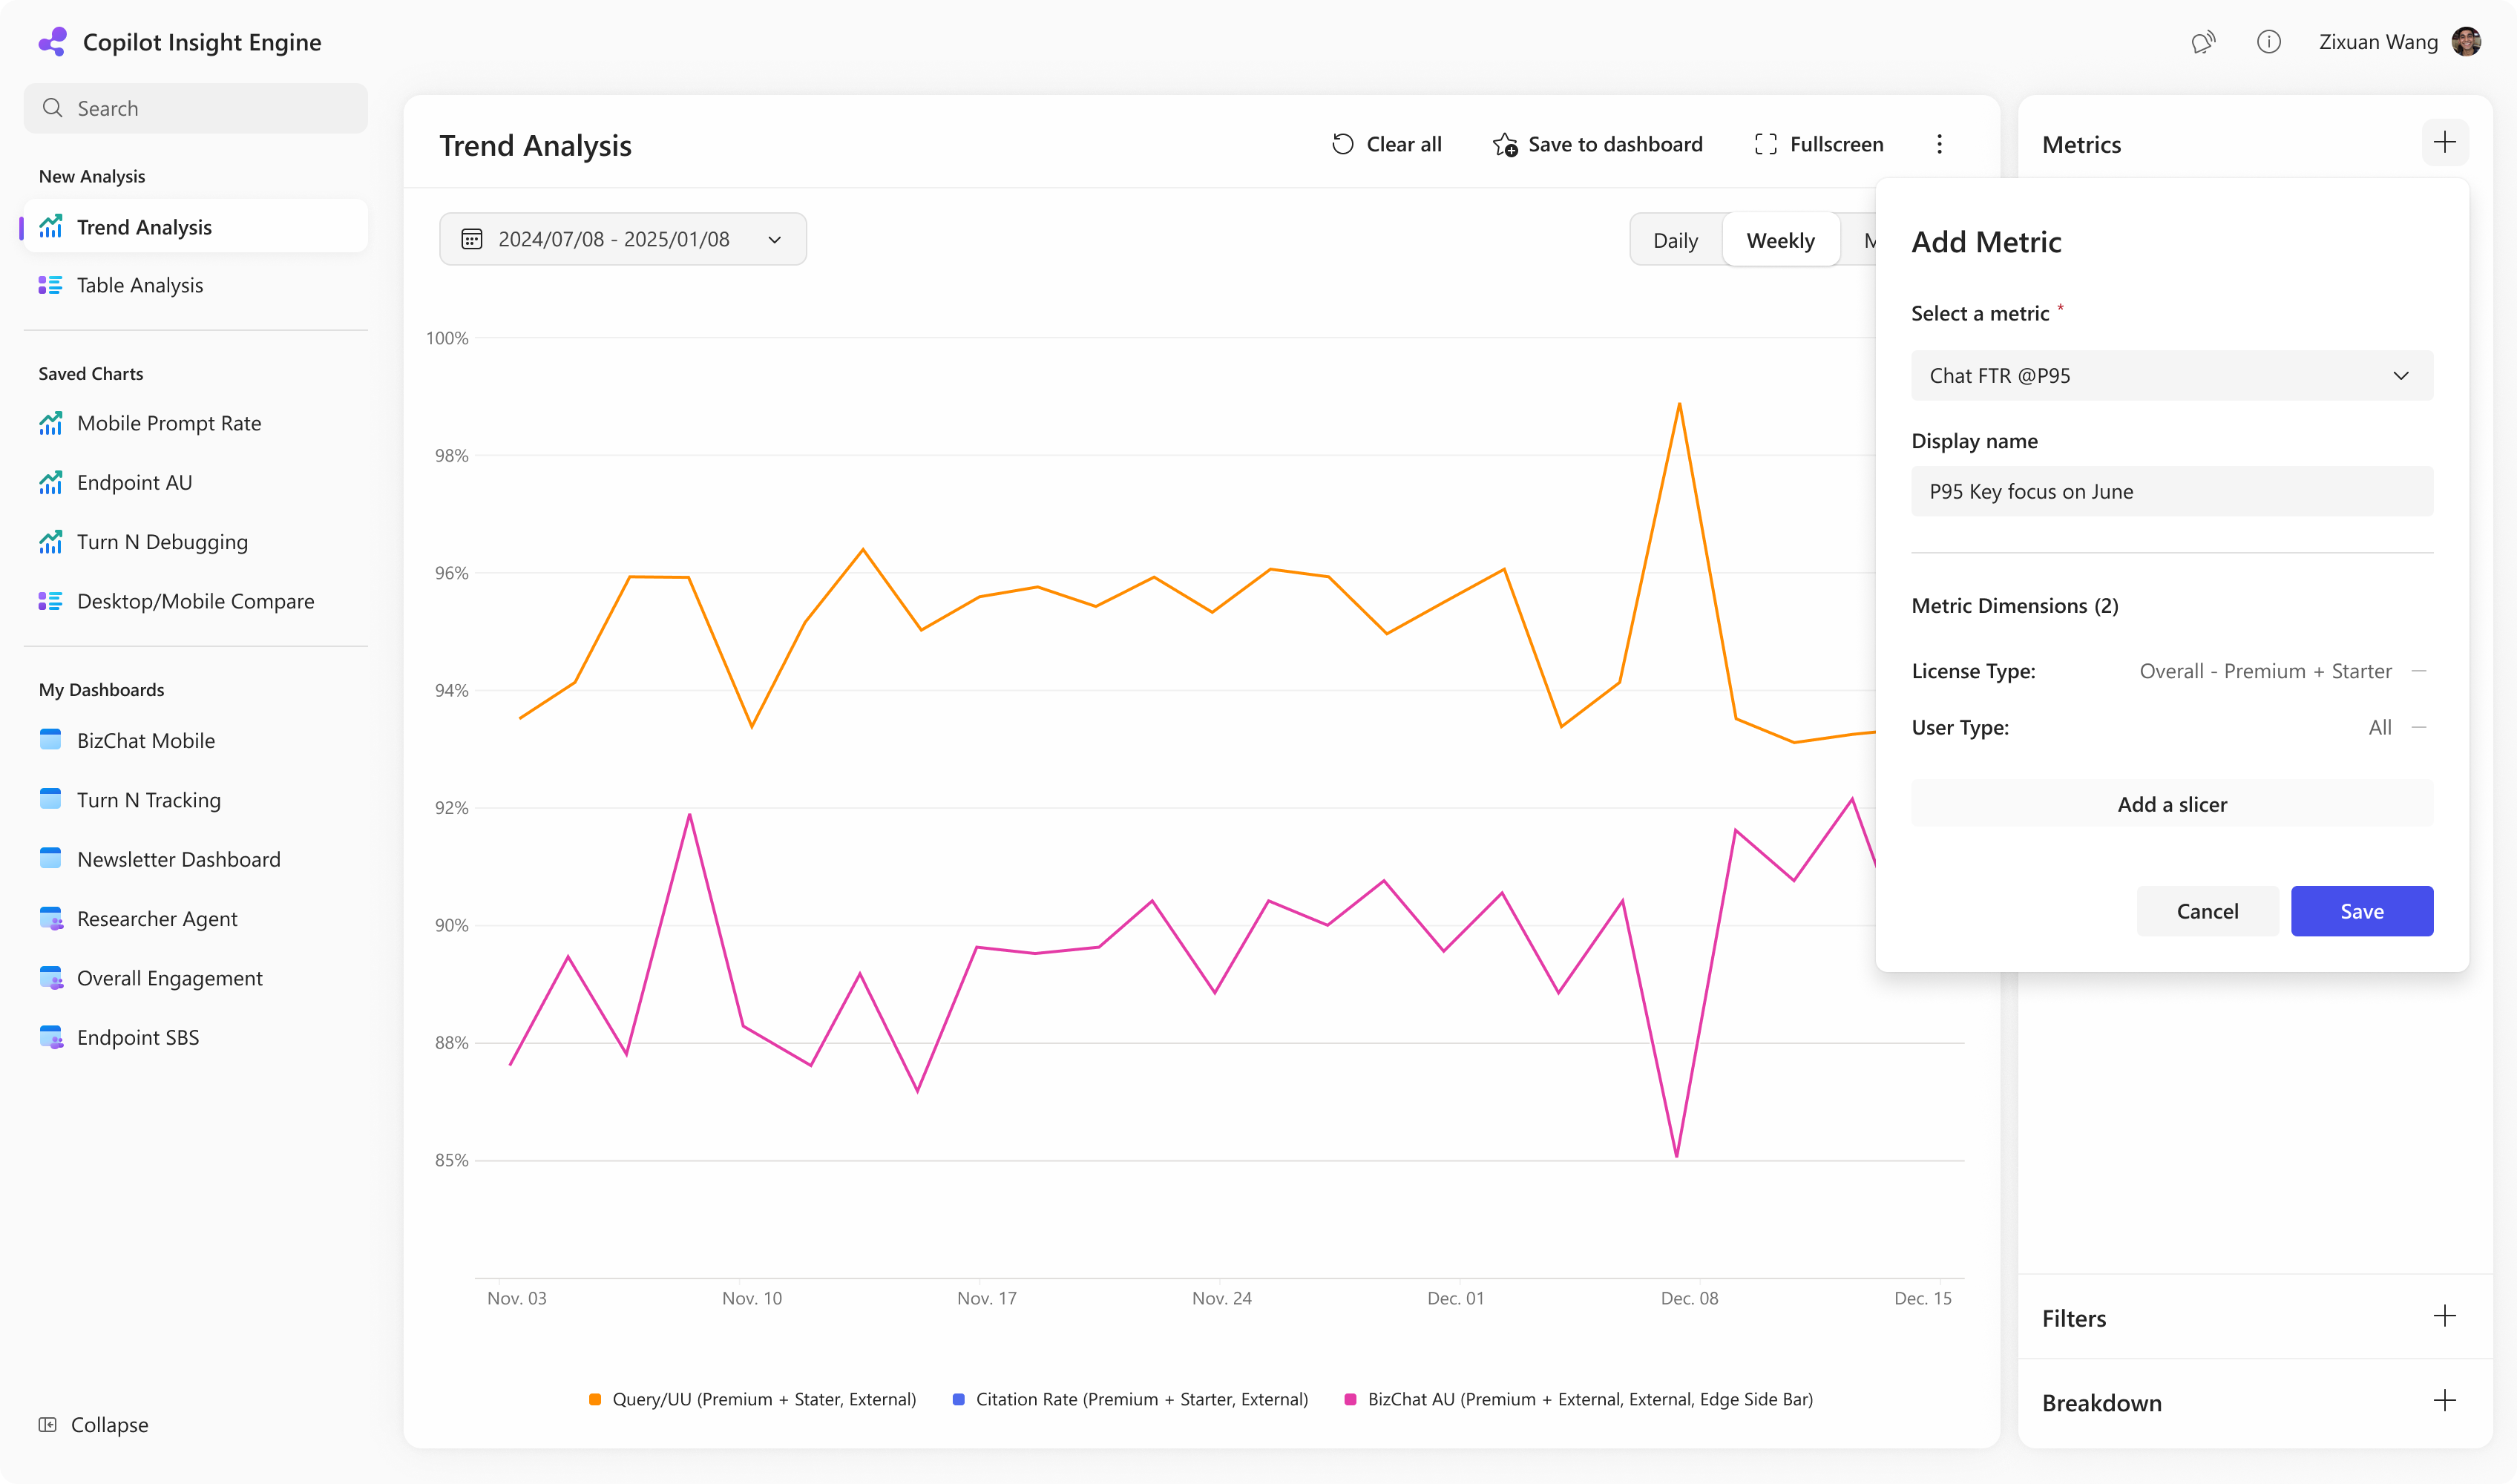
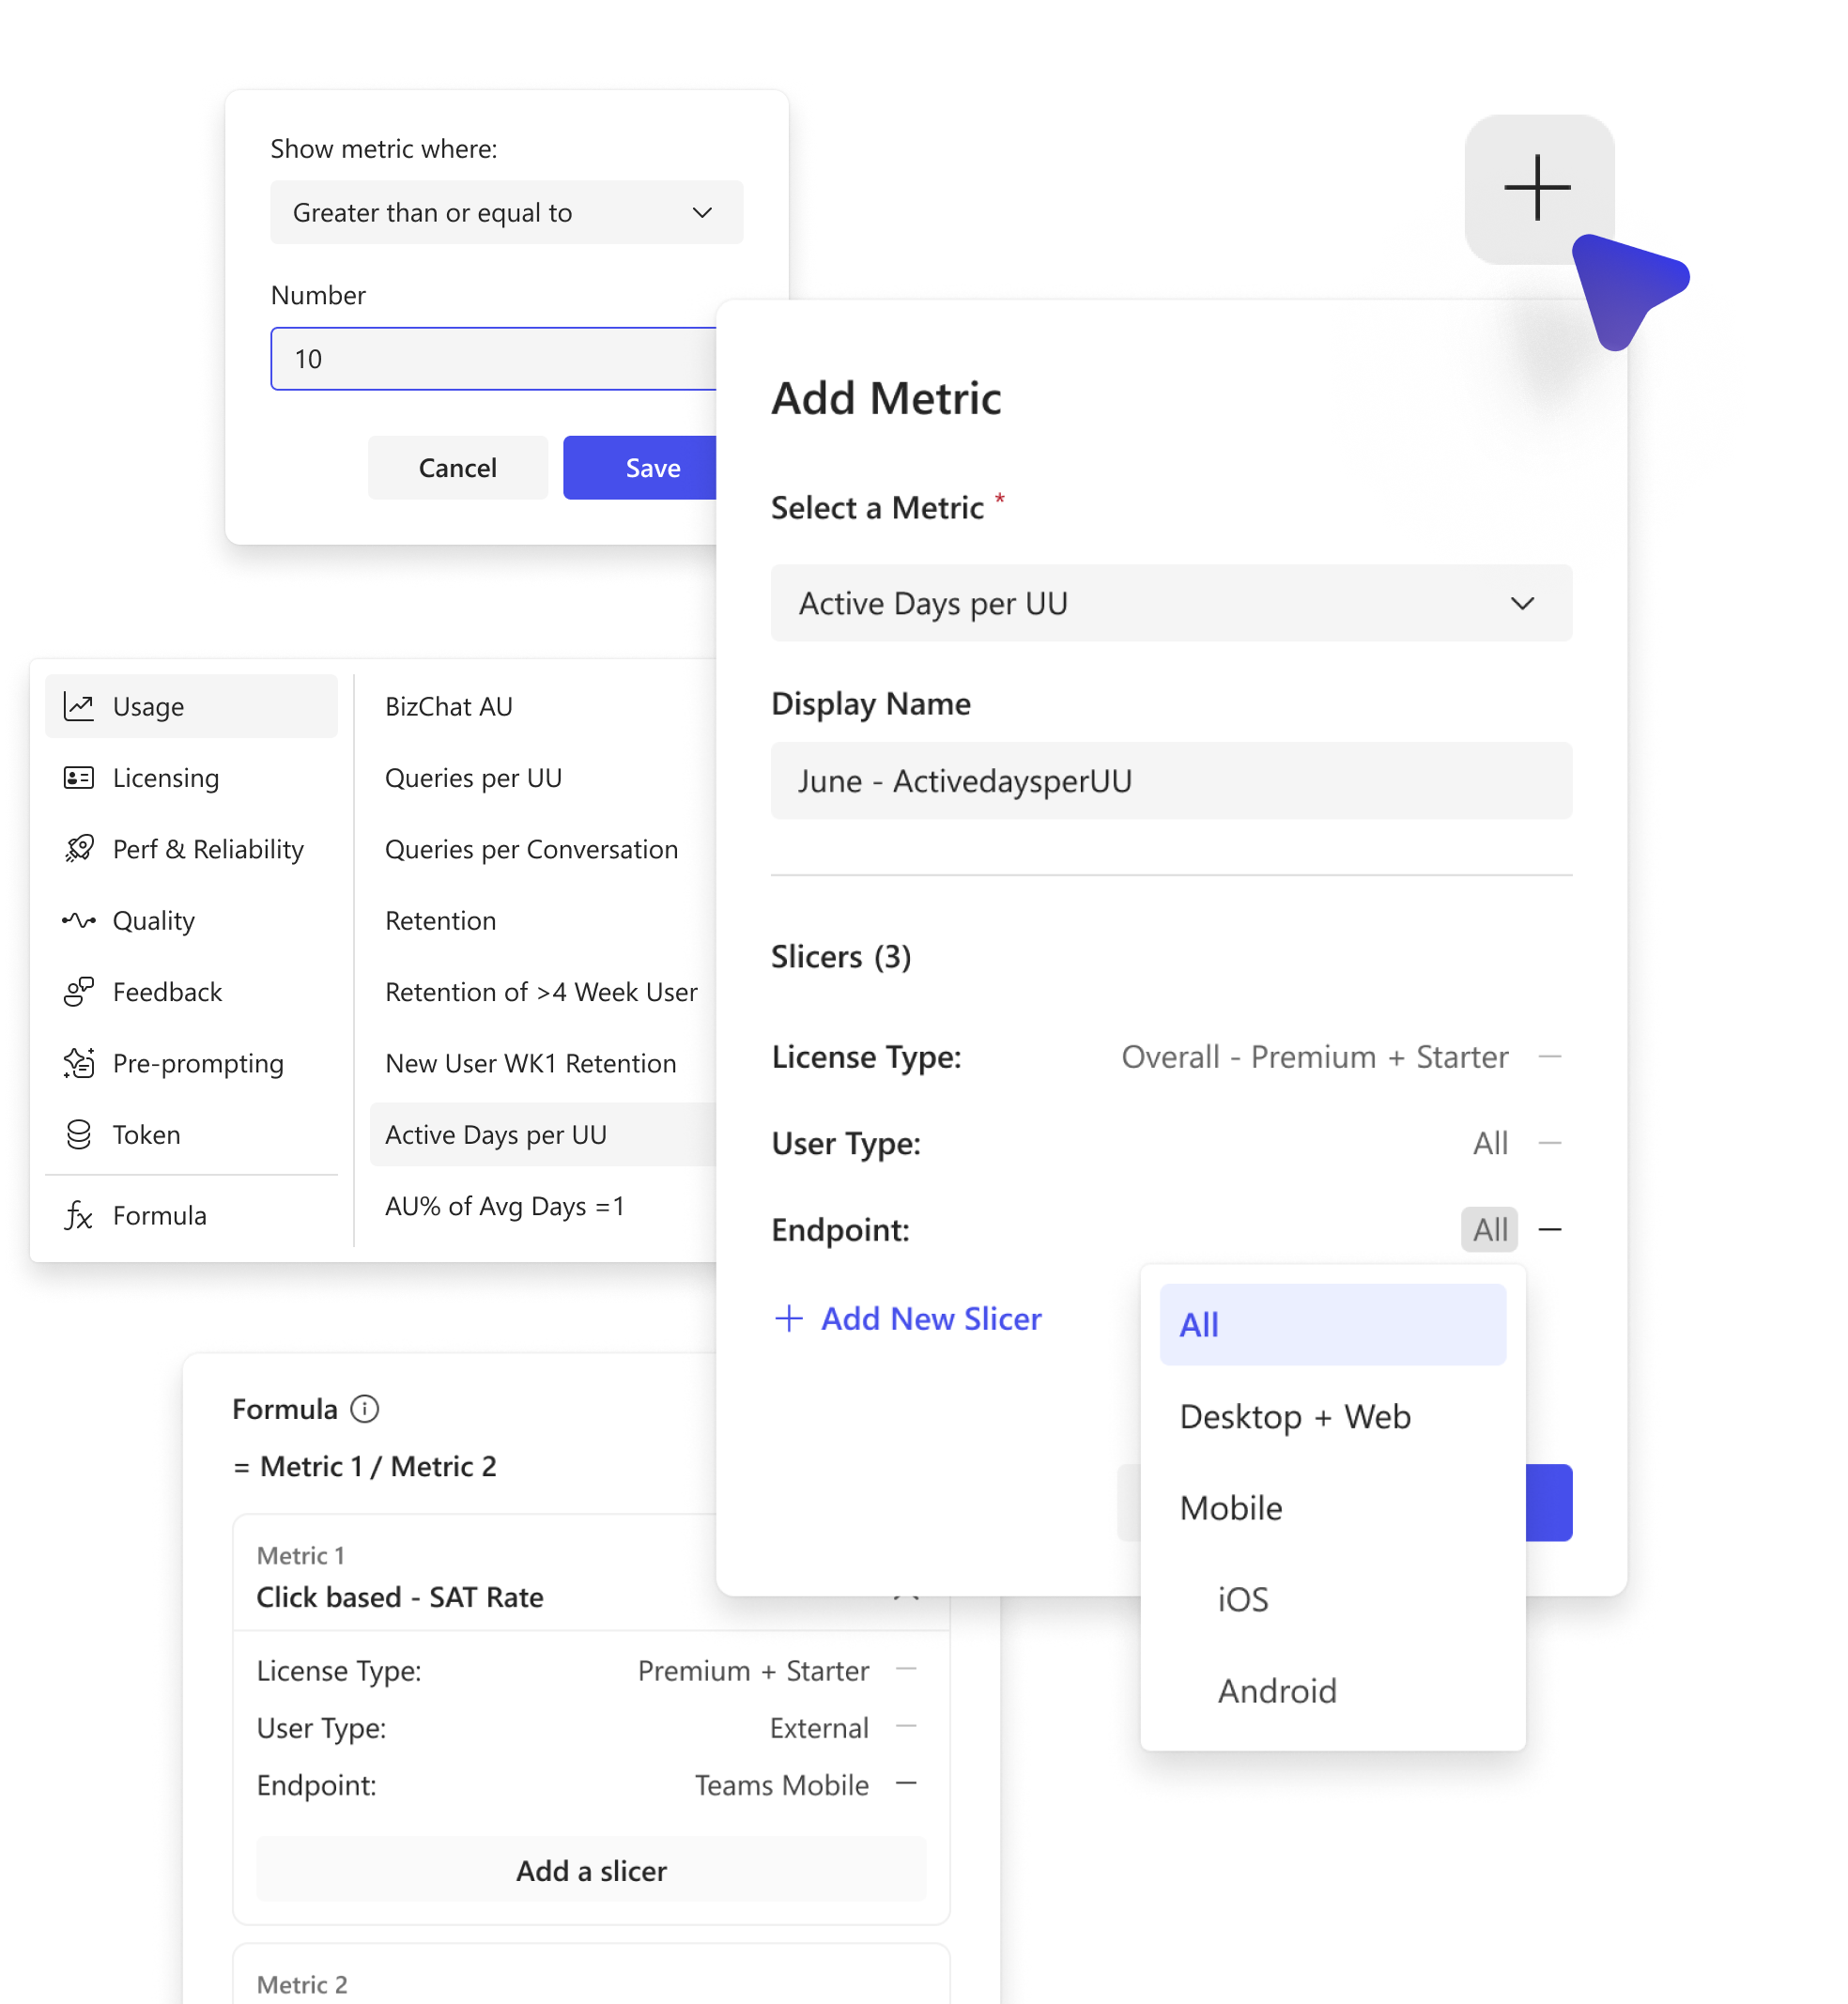
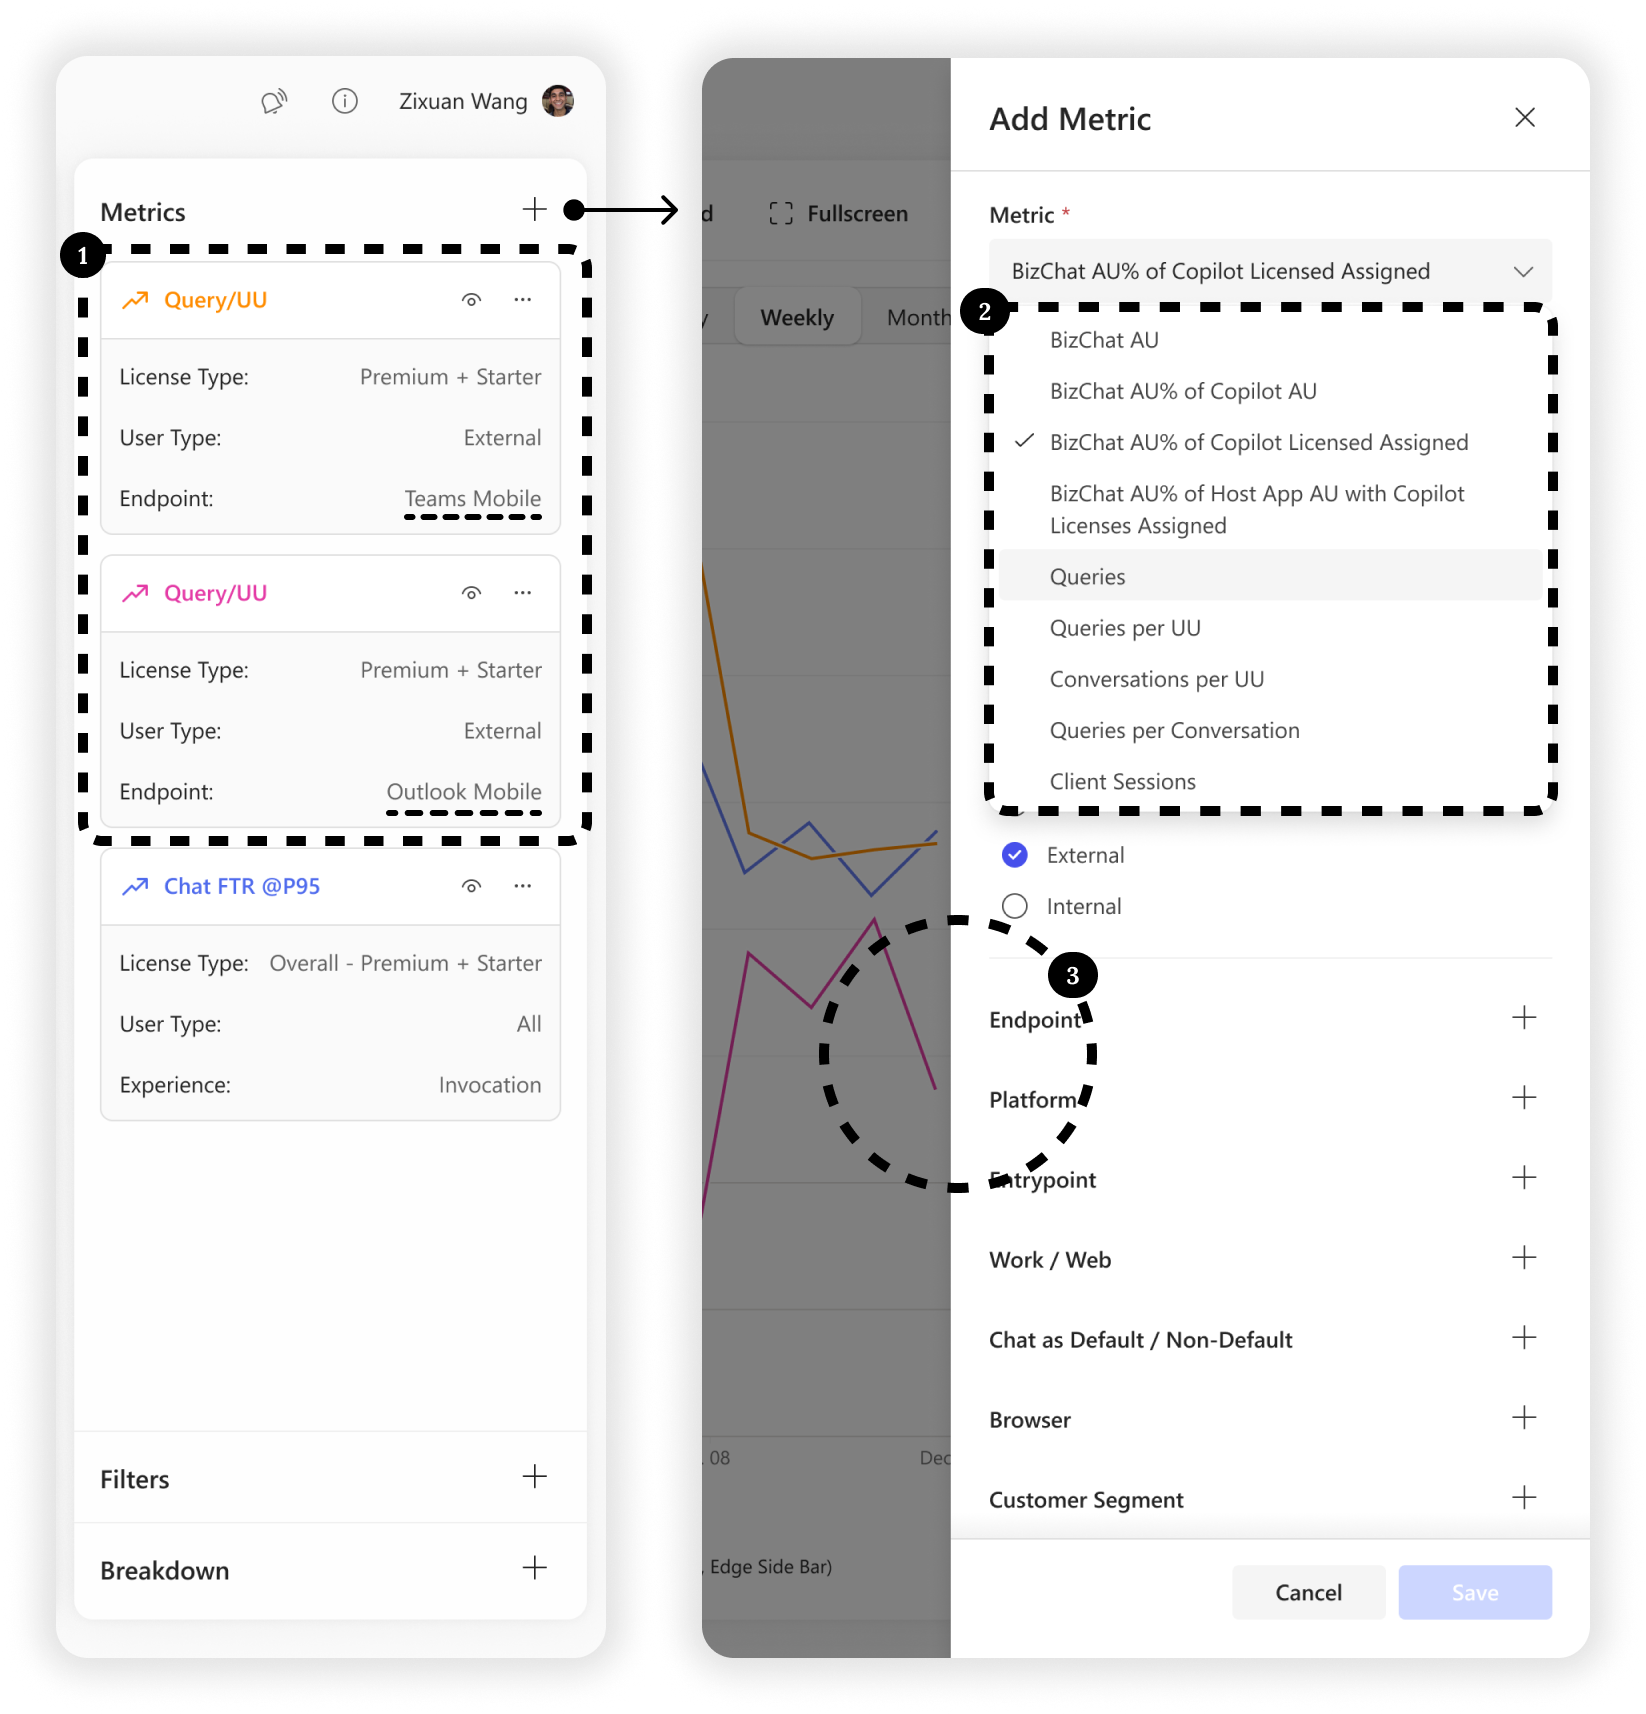
Design Showcase
Add New Metric
Support user can easily and simply create and manage their metrics cards based on user needs.
AB Formula
Introducing metric customization through formulas, enabling users to define their own metrics instantly using existing ones. E.g. Mobile query / All query.
Benefits:
- •Users can flexibly create customized metrics that better align with specific analytical needs.
- •Users can quickly define and utilize custom metrics within minutes, without needing to wait for CIE team support.
Customize Slicer Value
For some metrics, defining a clear threshold was essential — only values exceeding that benchmark carry real analytical meaning and deserve to be monitored and evaluated. E.g. Queries/UU >= 10 in Retention.
Benefits:
- •Users can further filter the data to gain a more intuitive view of performance. This feature provides an efficient way to quickly assess whether product outcomes meet the defined success metrics.
Trend / Table Interaction
Interaction Design
Based on user feedback, I introduced a new user experience that enables seamless switching between trend (line) and table views, allowing users to explore data point trends directly from the table. This significantly enhances the flexibility and efficiency of analysis.
August 2025

Background
In CIE, users often need both tabular and trend views to fully understand their data. Currently, switching between these views requires manual reconfiguration, which is time-consuming and disrupts the analytical flow.
Problem Statement
2 Analysis Mode, 2 Entry-points, 2 Configuration
"As a user, I want to switch between table and trend views with one click, so I can compare values and trends without reconfiguring the chart."
Ad-hoc analysis of anomalies in table view is cumbersome
"I want to quickly view the trend of that specific data point over the past week to understand whether the drop was sudden or gradual—without changing the entire chart."
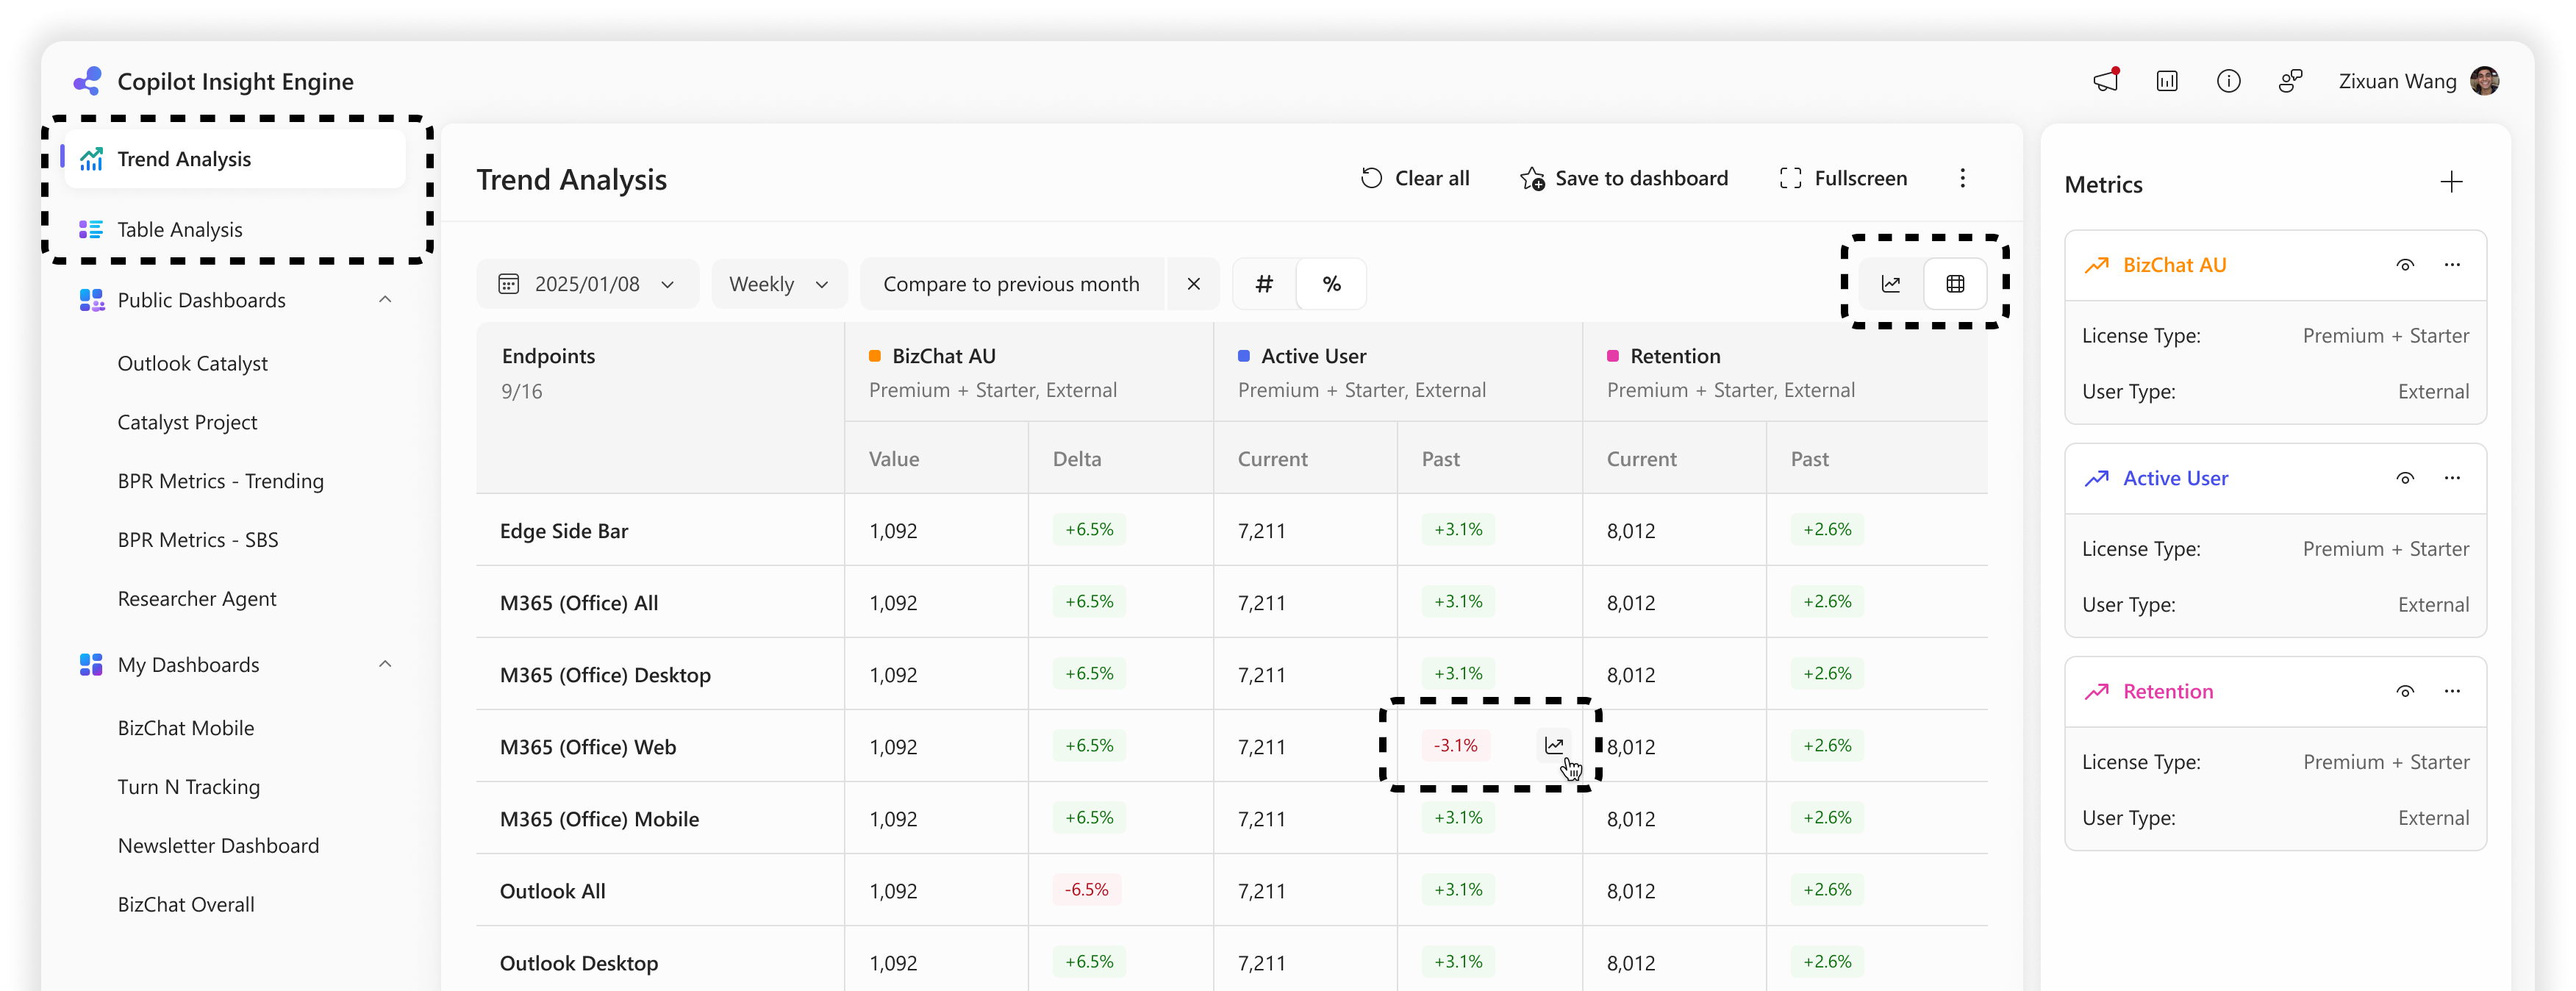
Proposal A
Remain current 2 tabs of the Trend/Table analysis, provide various switch button.
Pros
- •Minimal change to existing navigation structure.
- •Preserves user familiarity with current layout.
Cons
- •Mixing two analysis modes and two view types could potentially confuse users and blur the boundaries between their purposes.
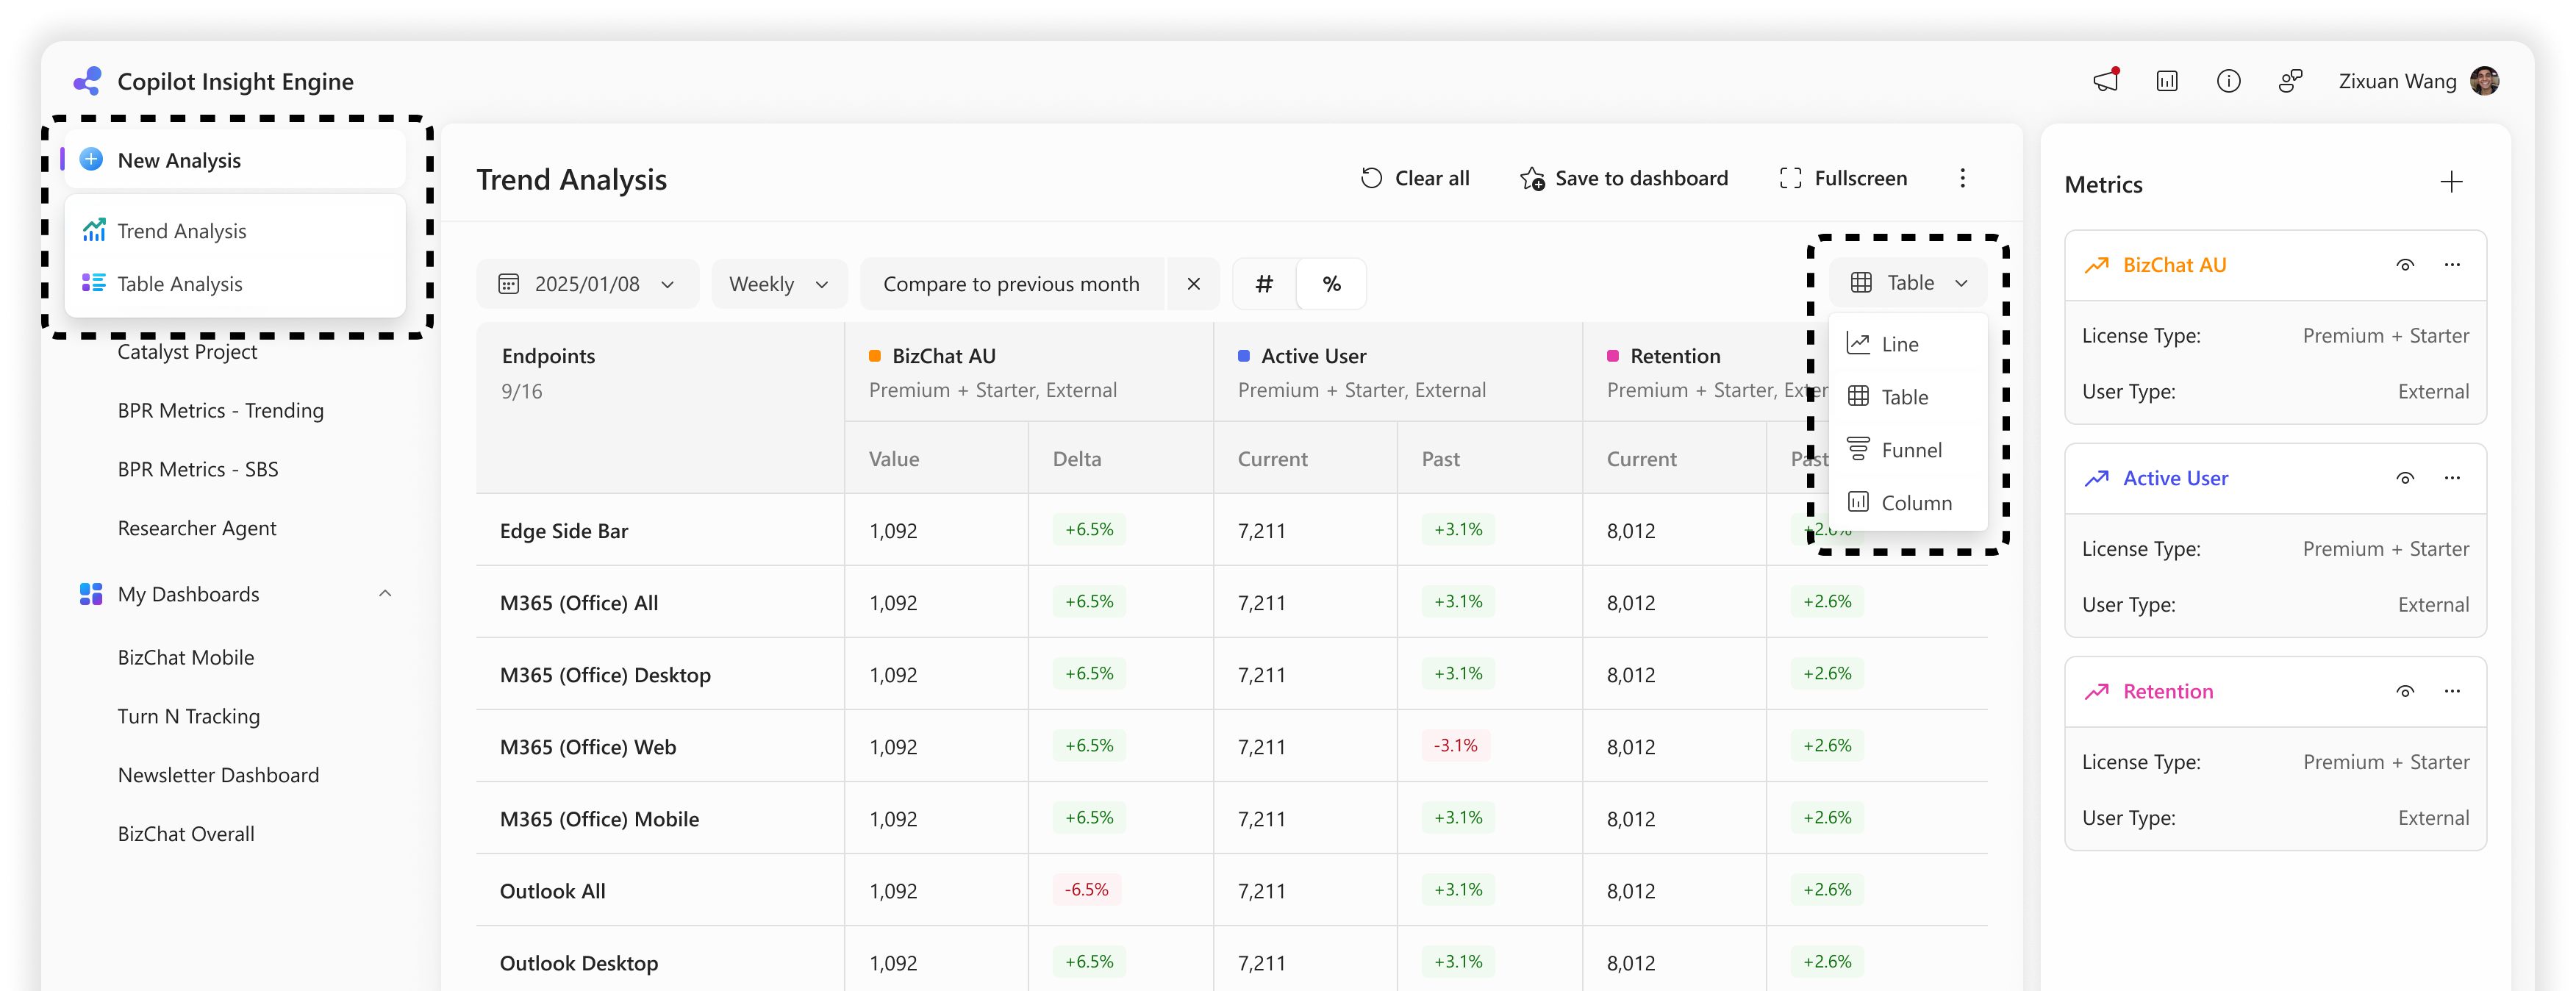
Proposal B
Replace 2 navigation entries with one: "Analysis". Add a chart selector dropdown inside "Analysis".
Pros
- •Simplifies navigation and mental model: one place for all analysis.
- •Easier to scale to future view types (e.g. funnel, column, ...).
Cons
- •Only one savable draft is available, serving as a playground for ad-hoc analysis.
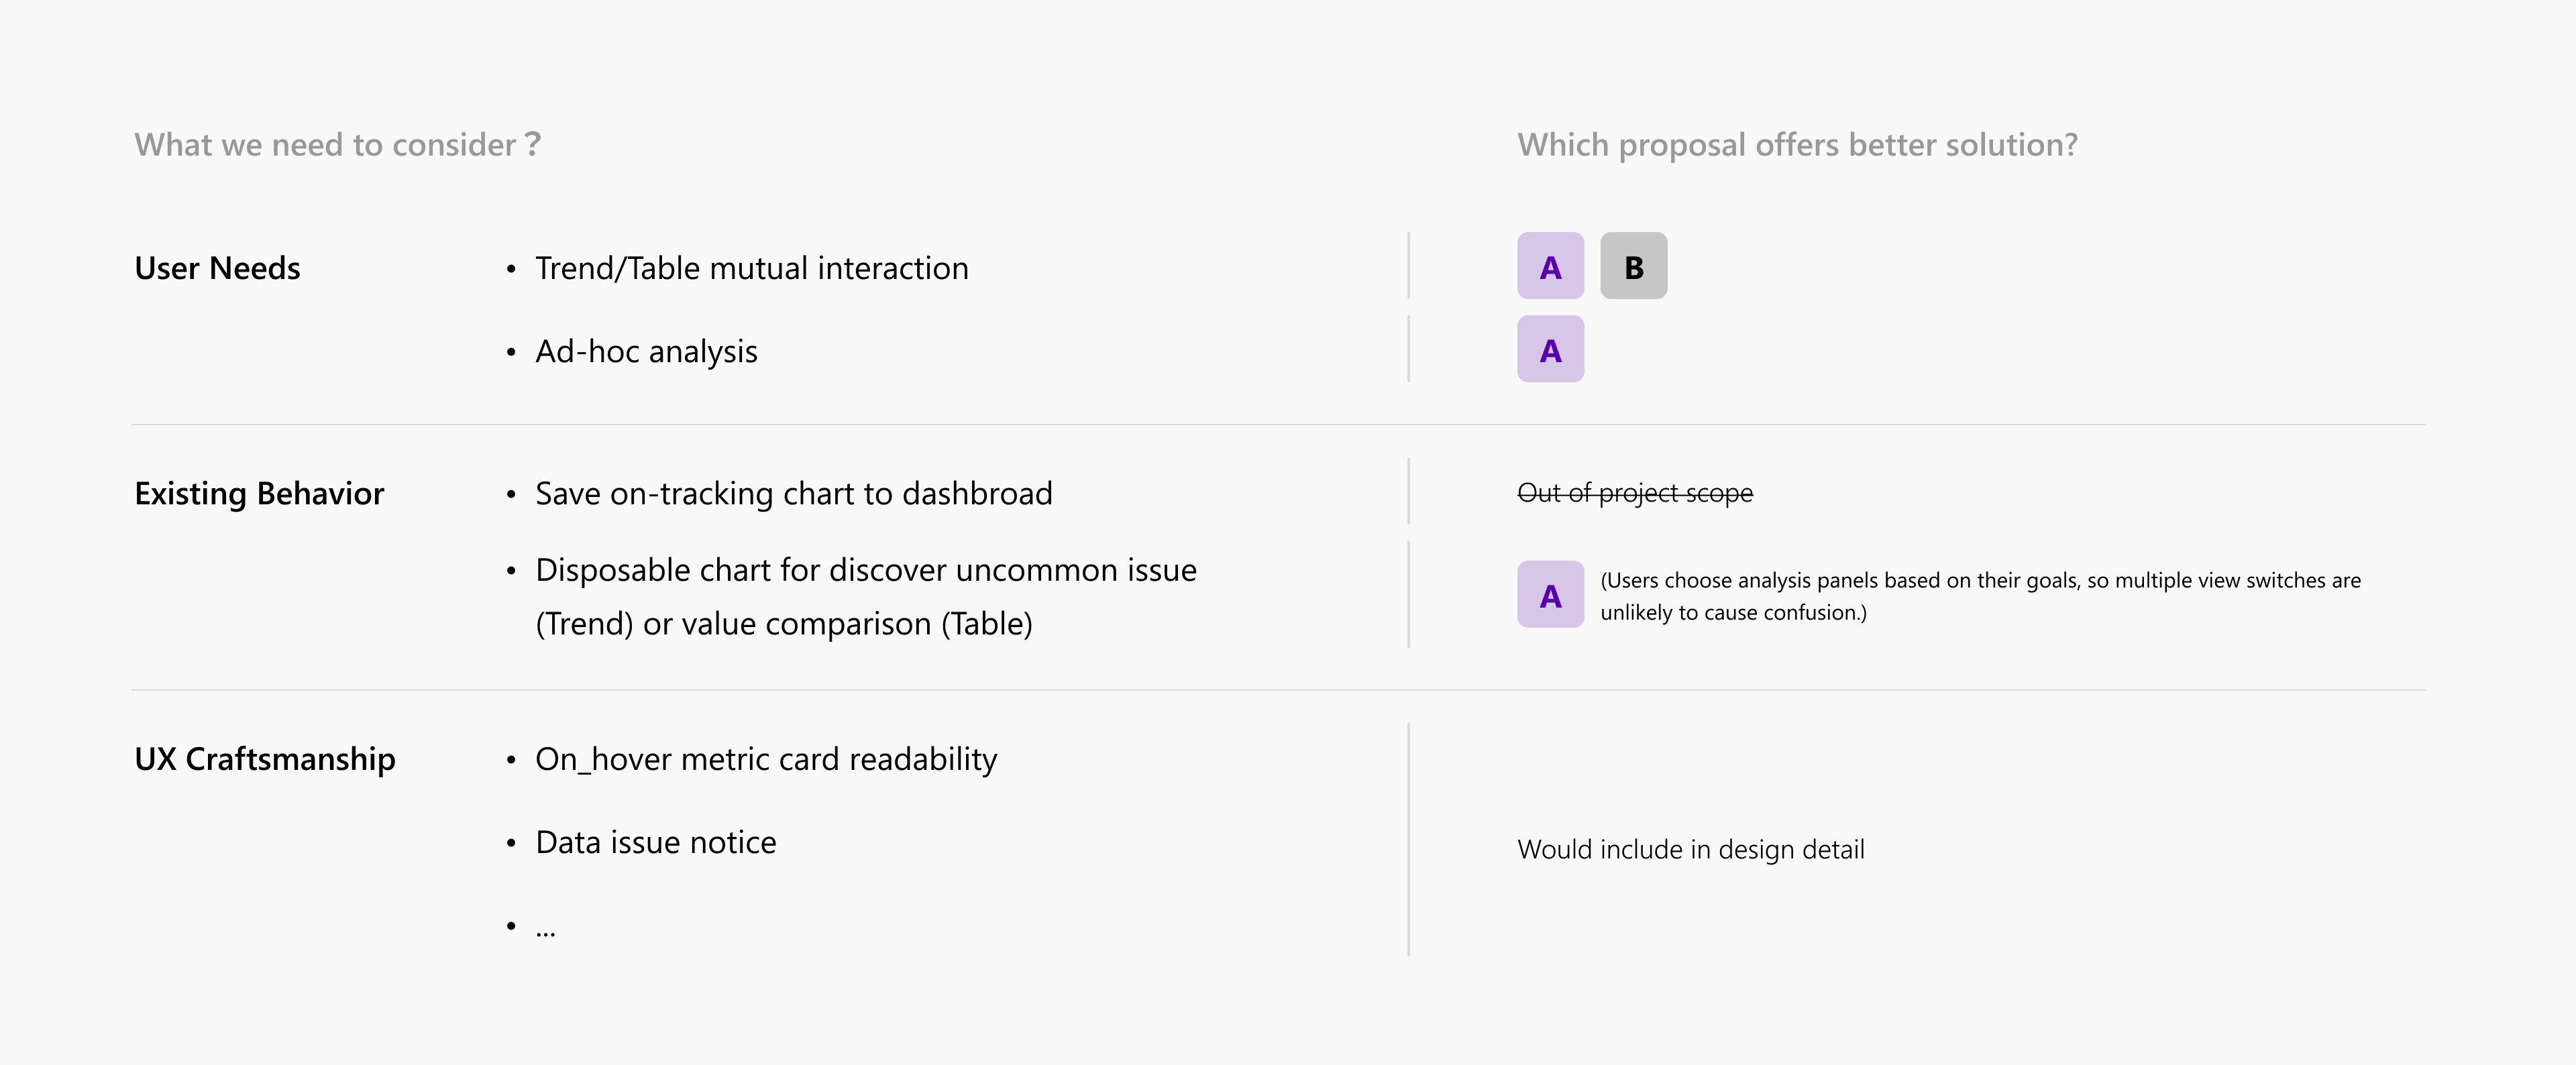
Concept Evaluation
After consideration of existing user behavior, preference and core needs, we decided to keep going deeper with Proposal A in detail.
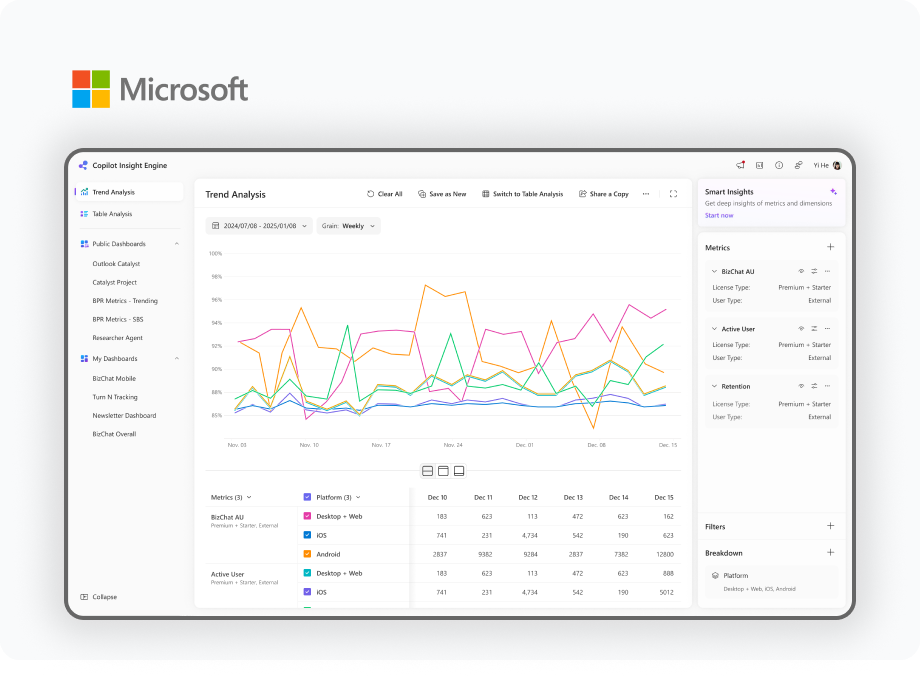
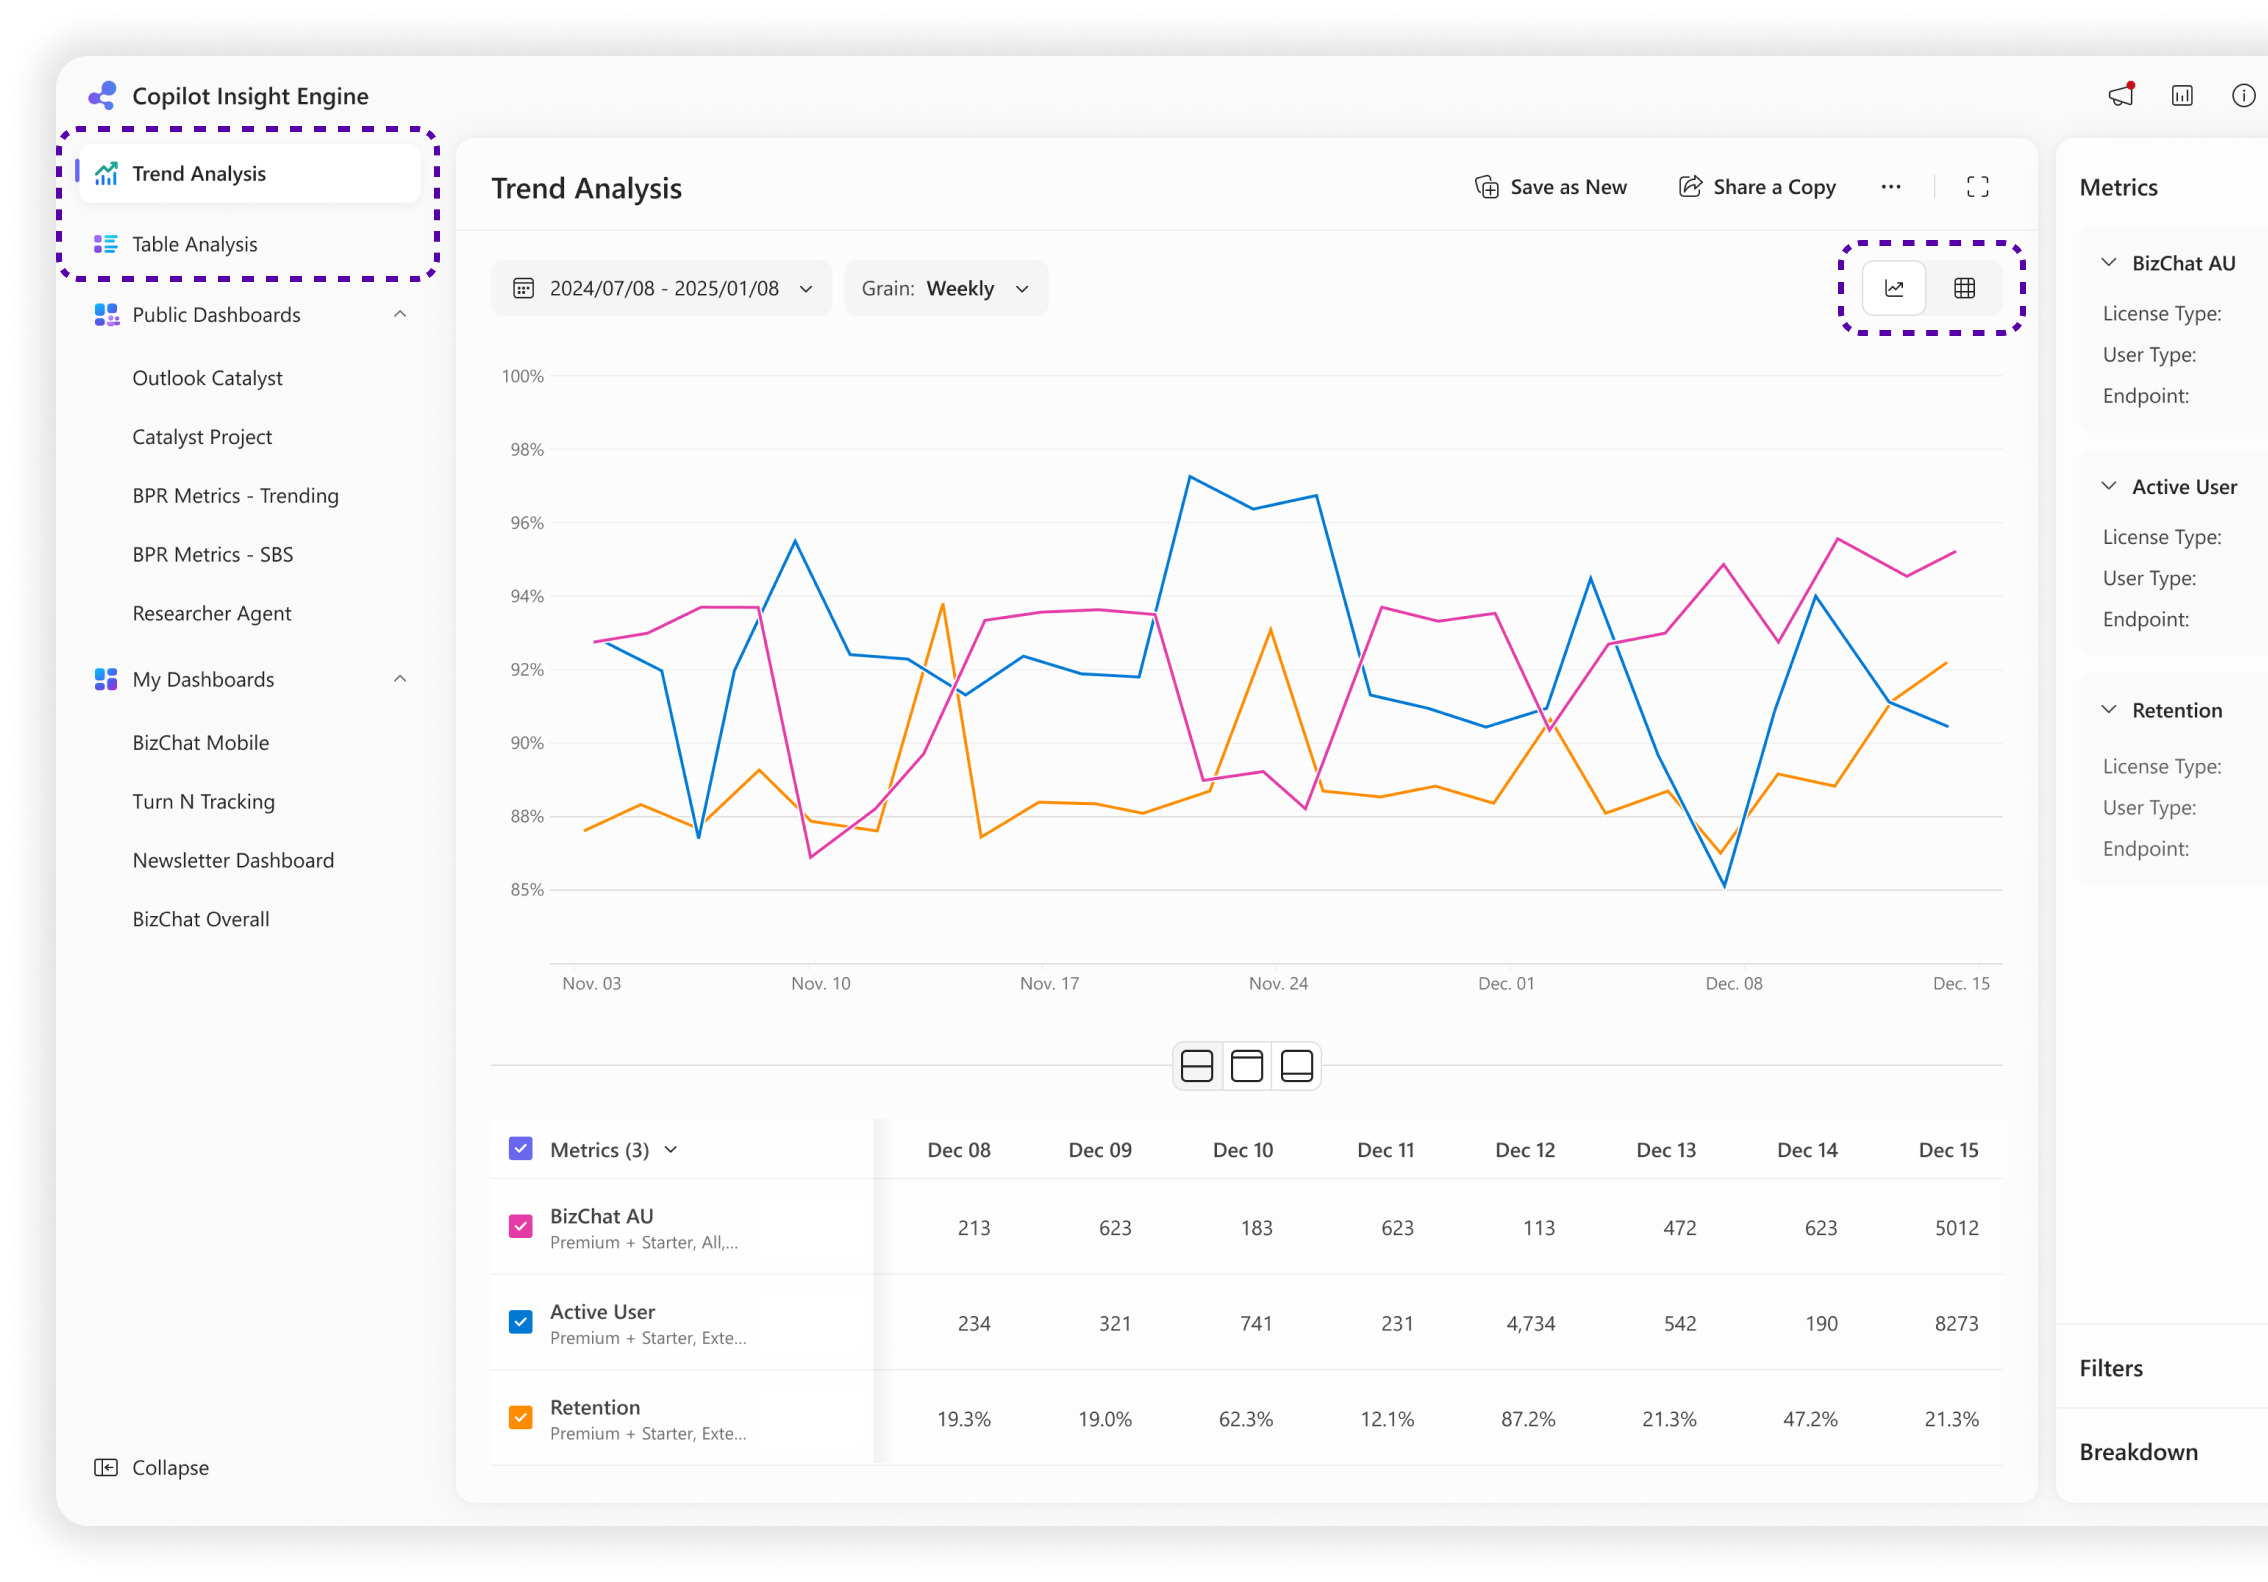
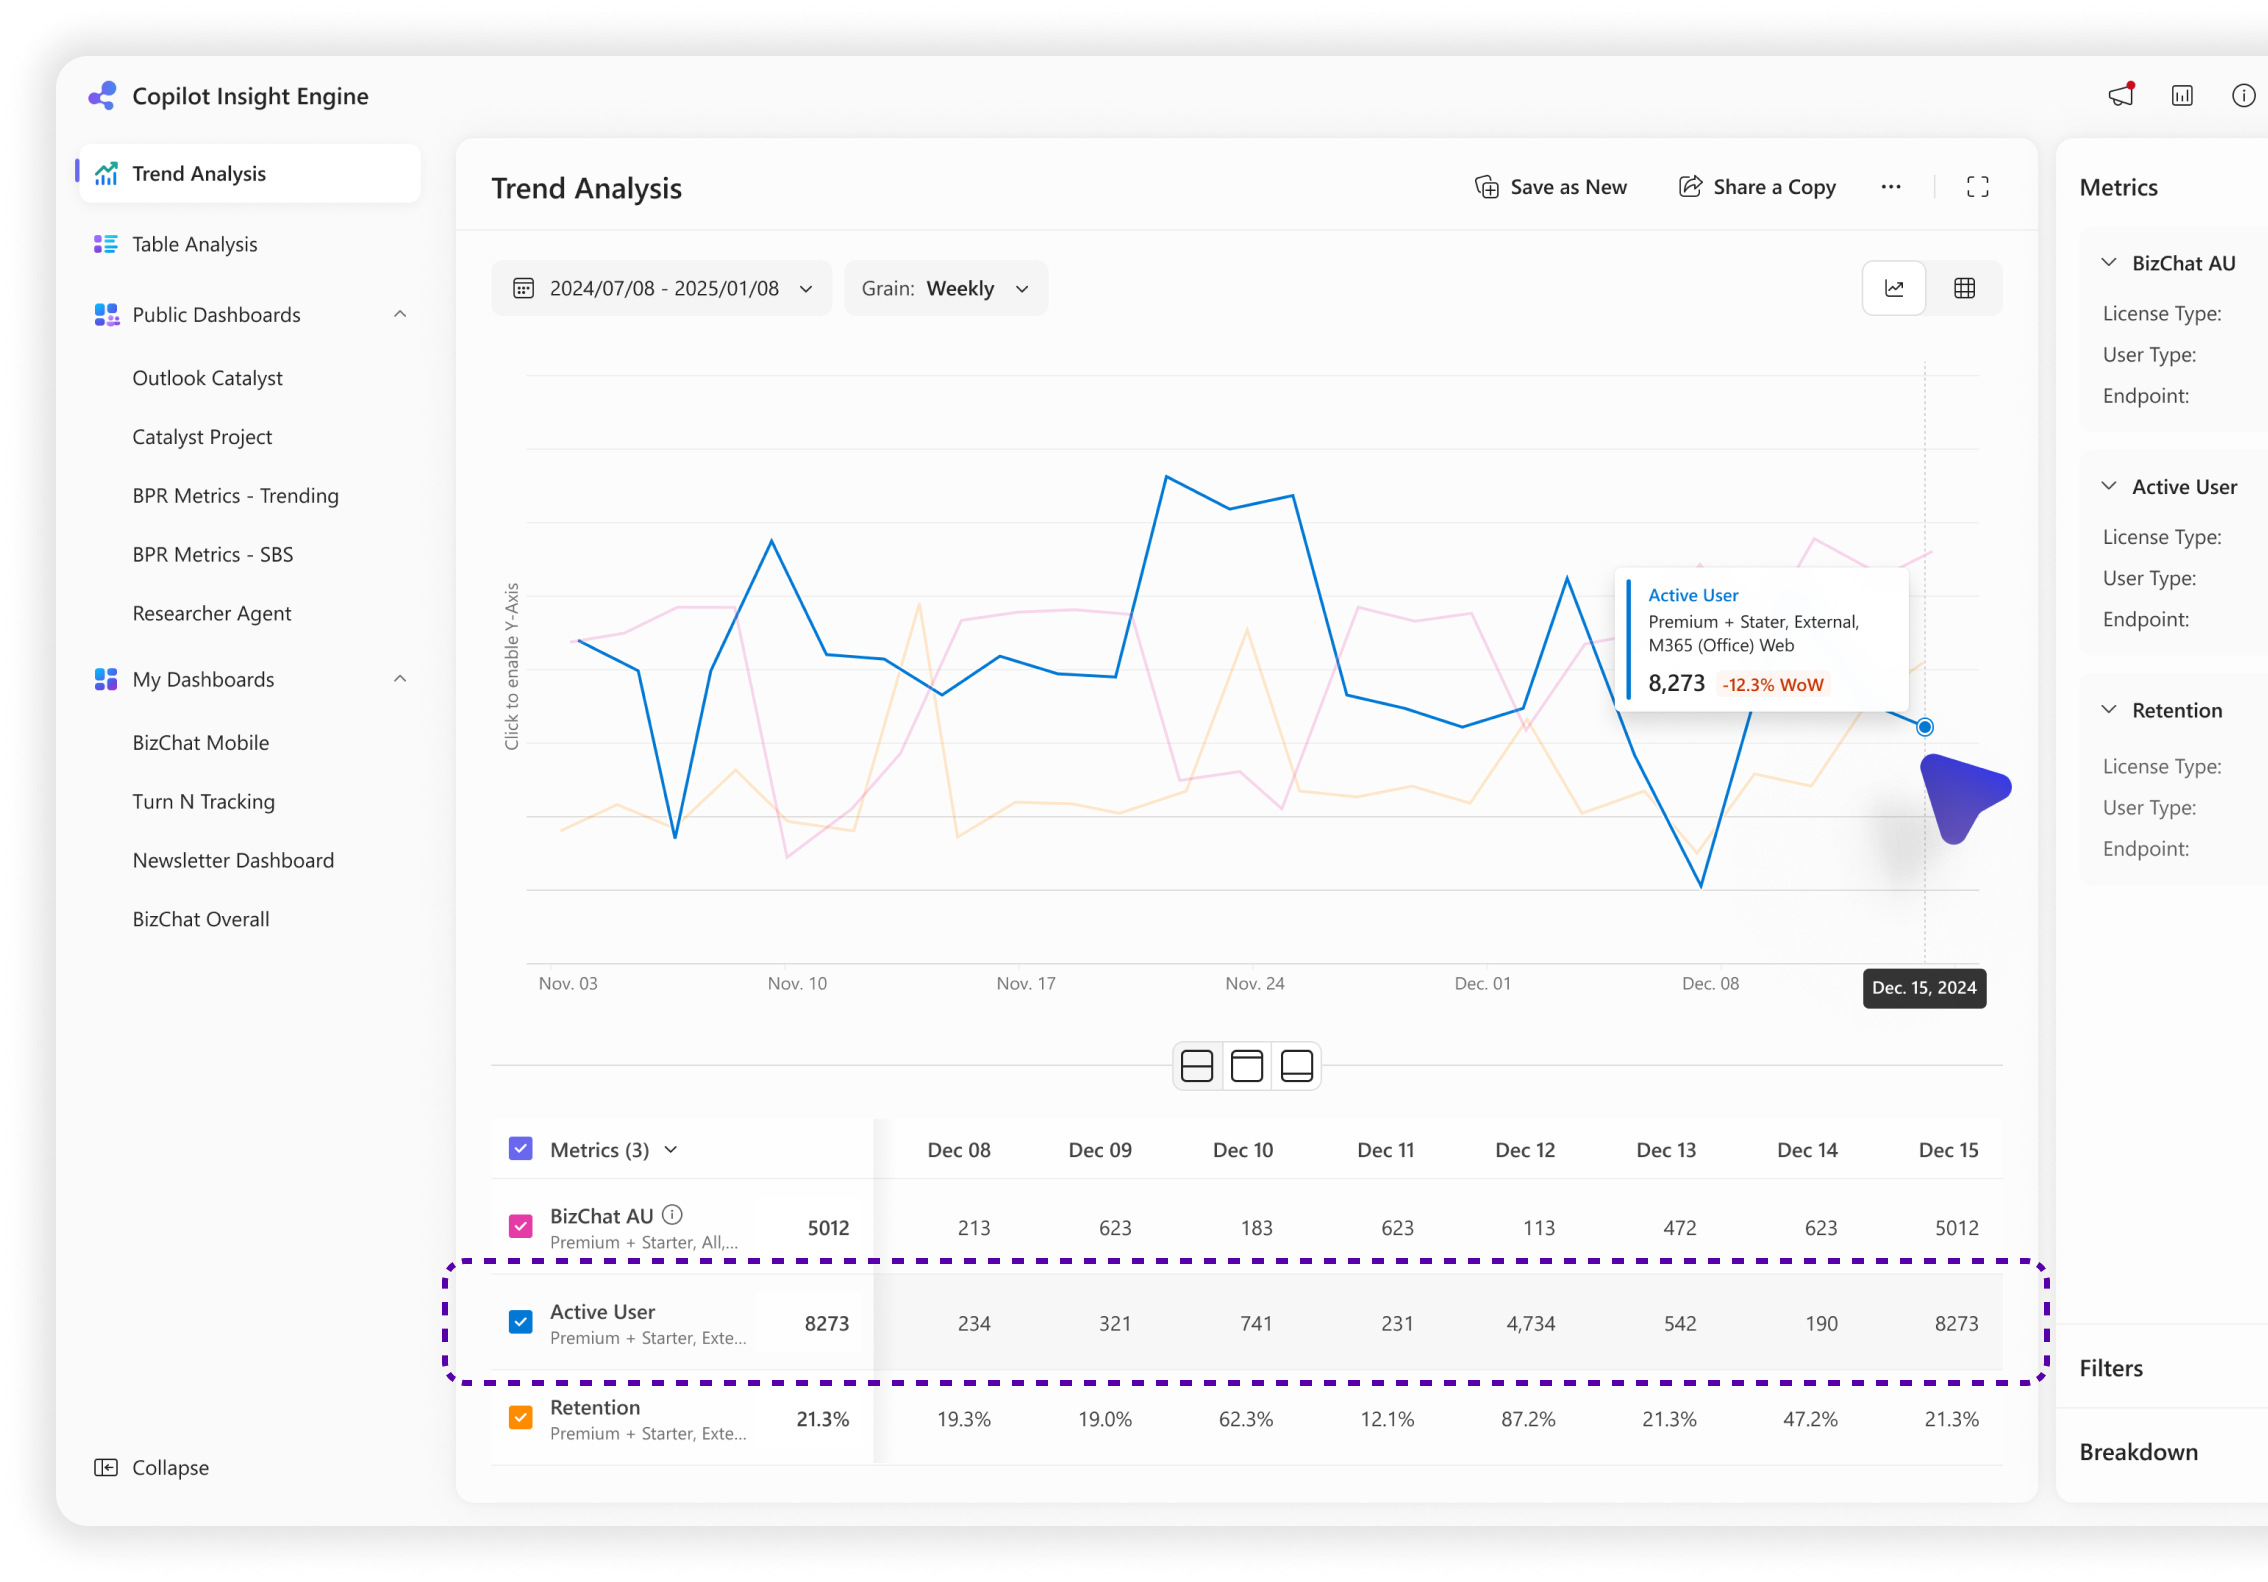
Solution — Scenario 1
Starting with a trend chart for trend over time, but need table chart for precise value comparison.
2 Analysis Mode & Chart View Switcher
Remain current 2 tabs of the Trend/Table analysis for ad-hoc analysis.
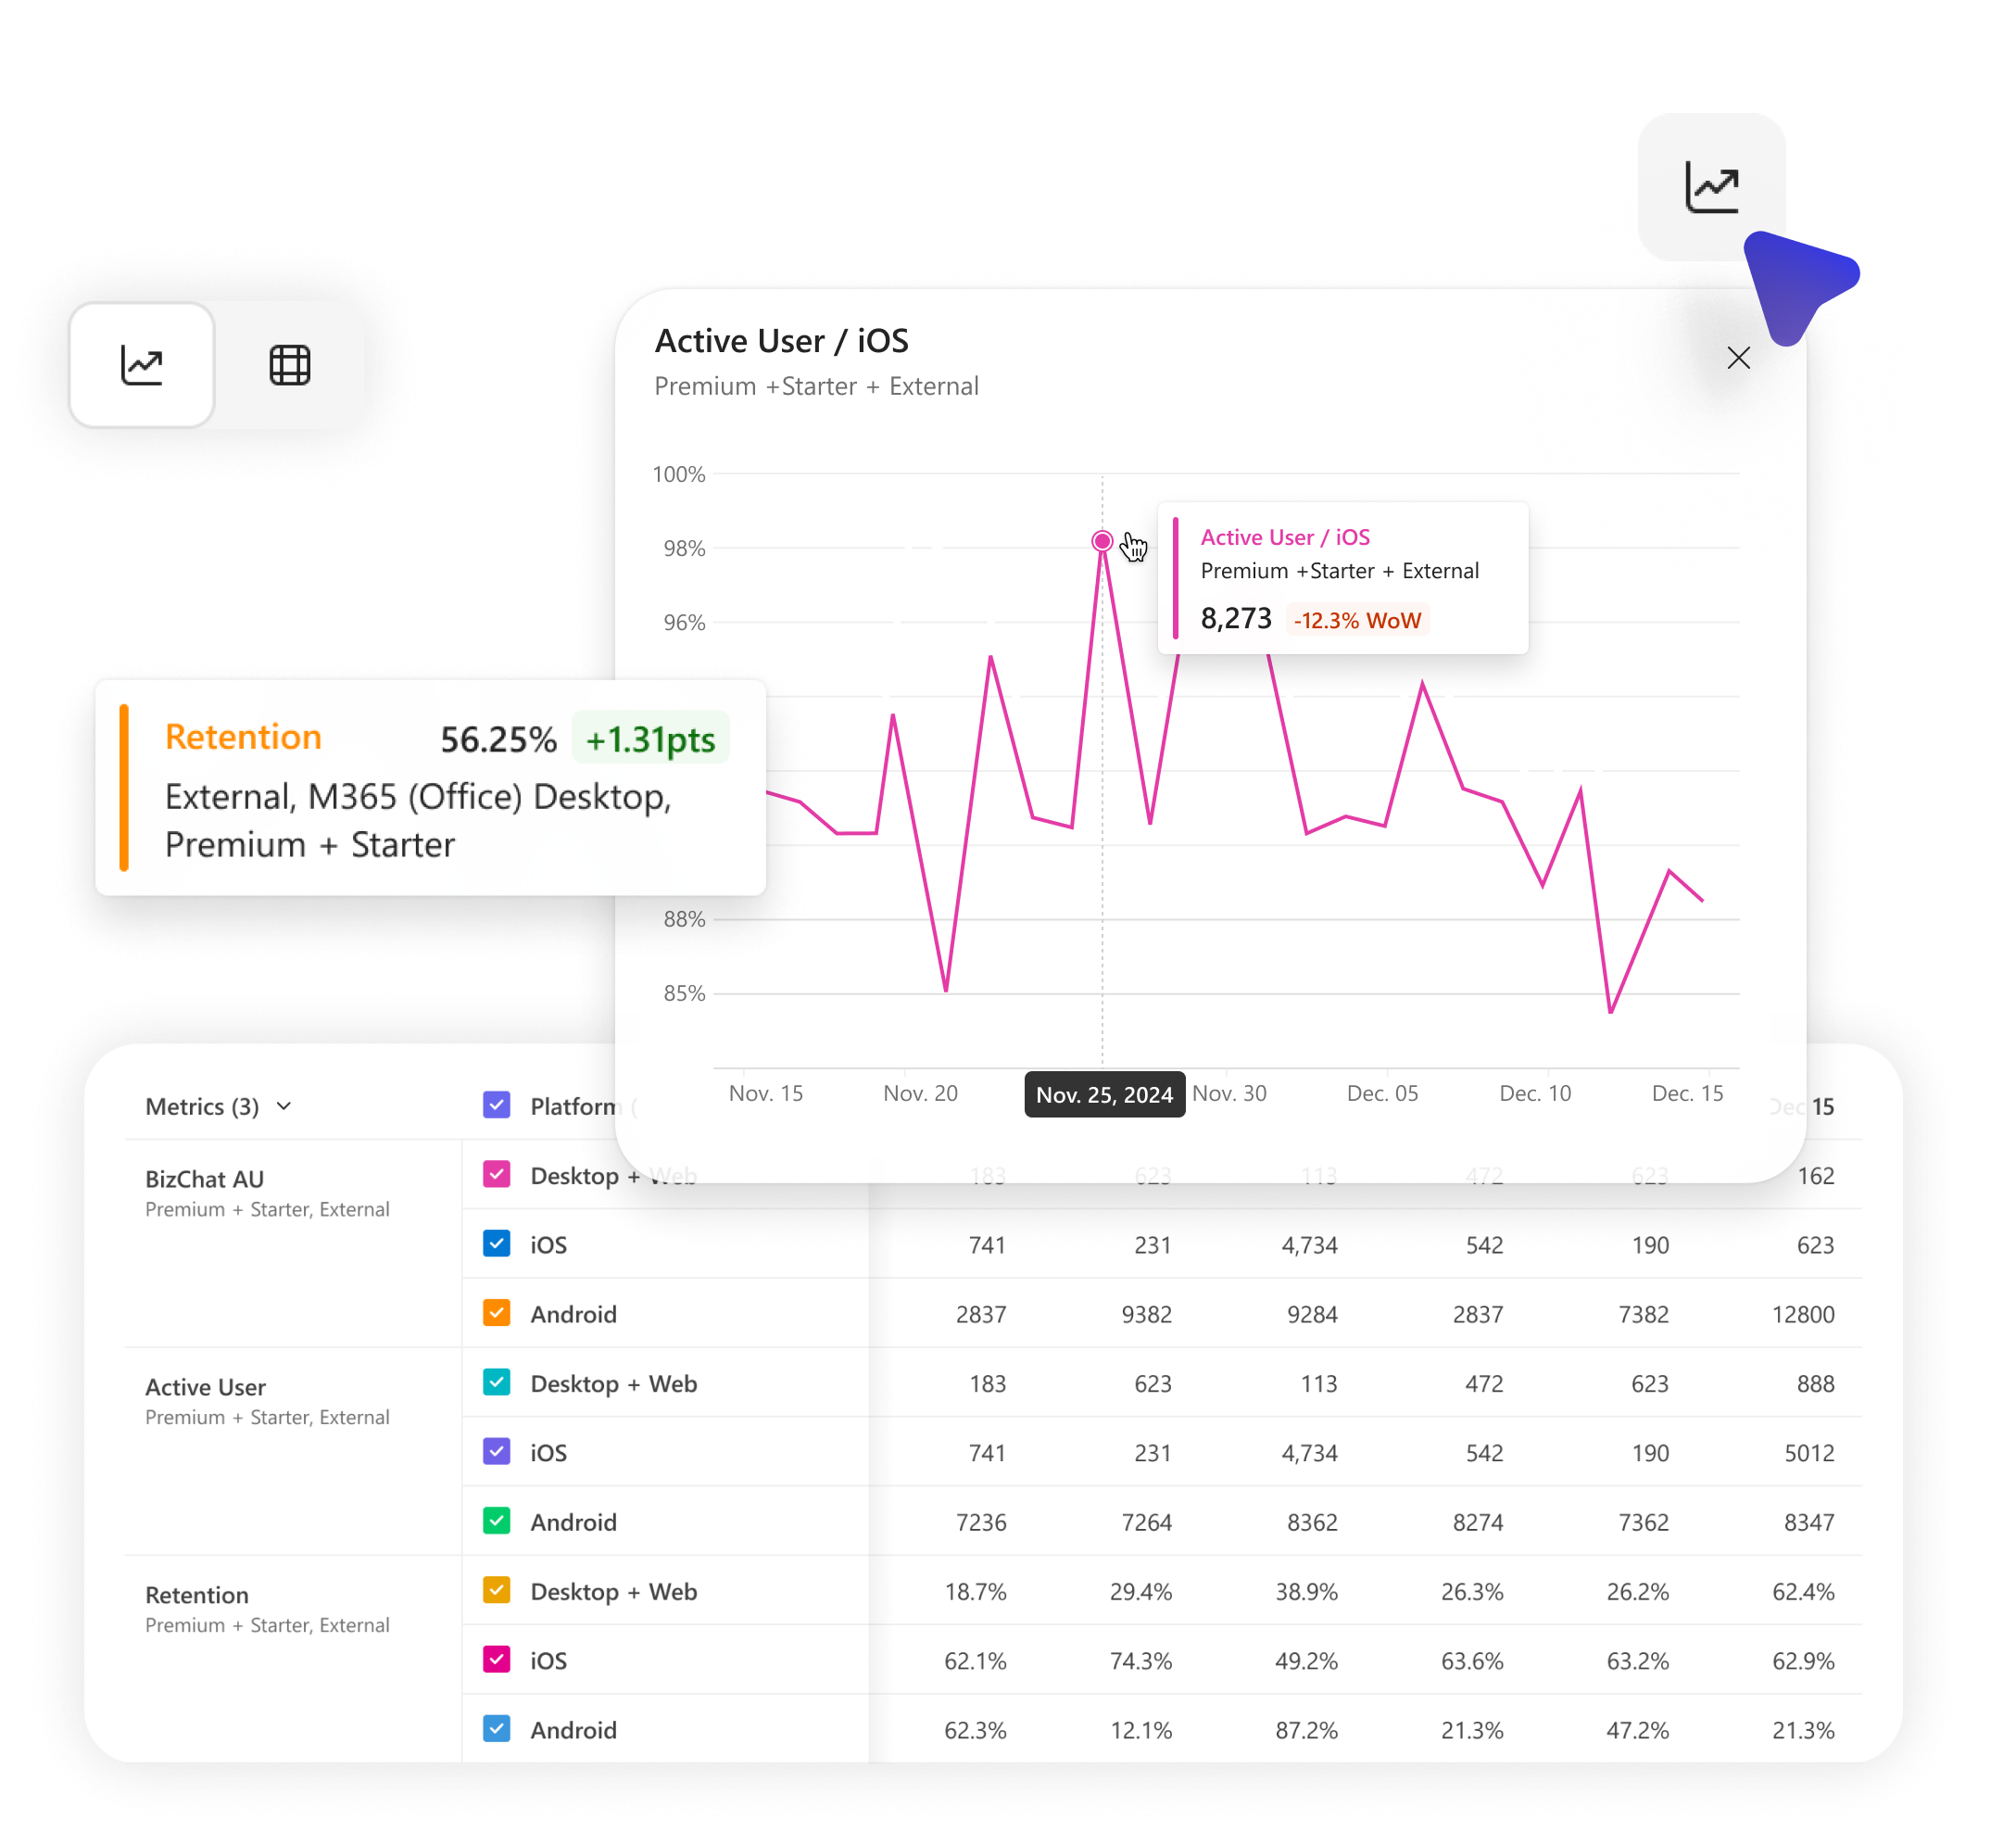
Line Chart w/ Table & Interactive effects
Line for trend and table for value. On-hover to highlight target metric trend and value.
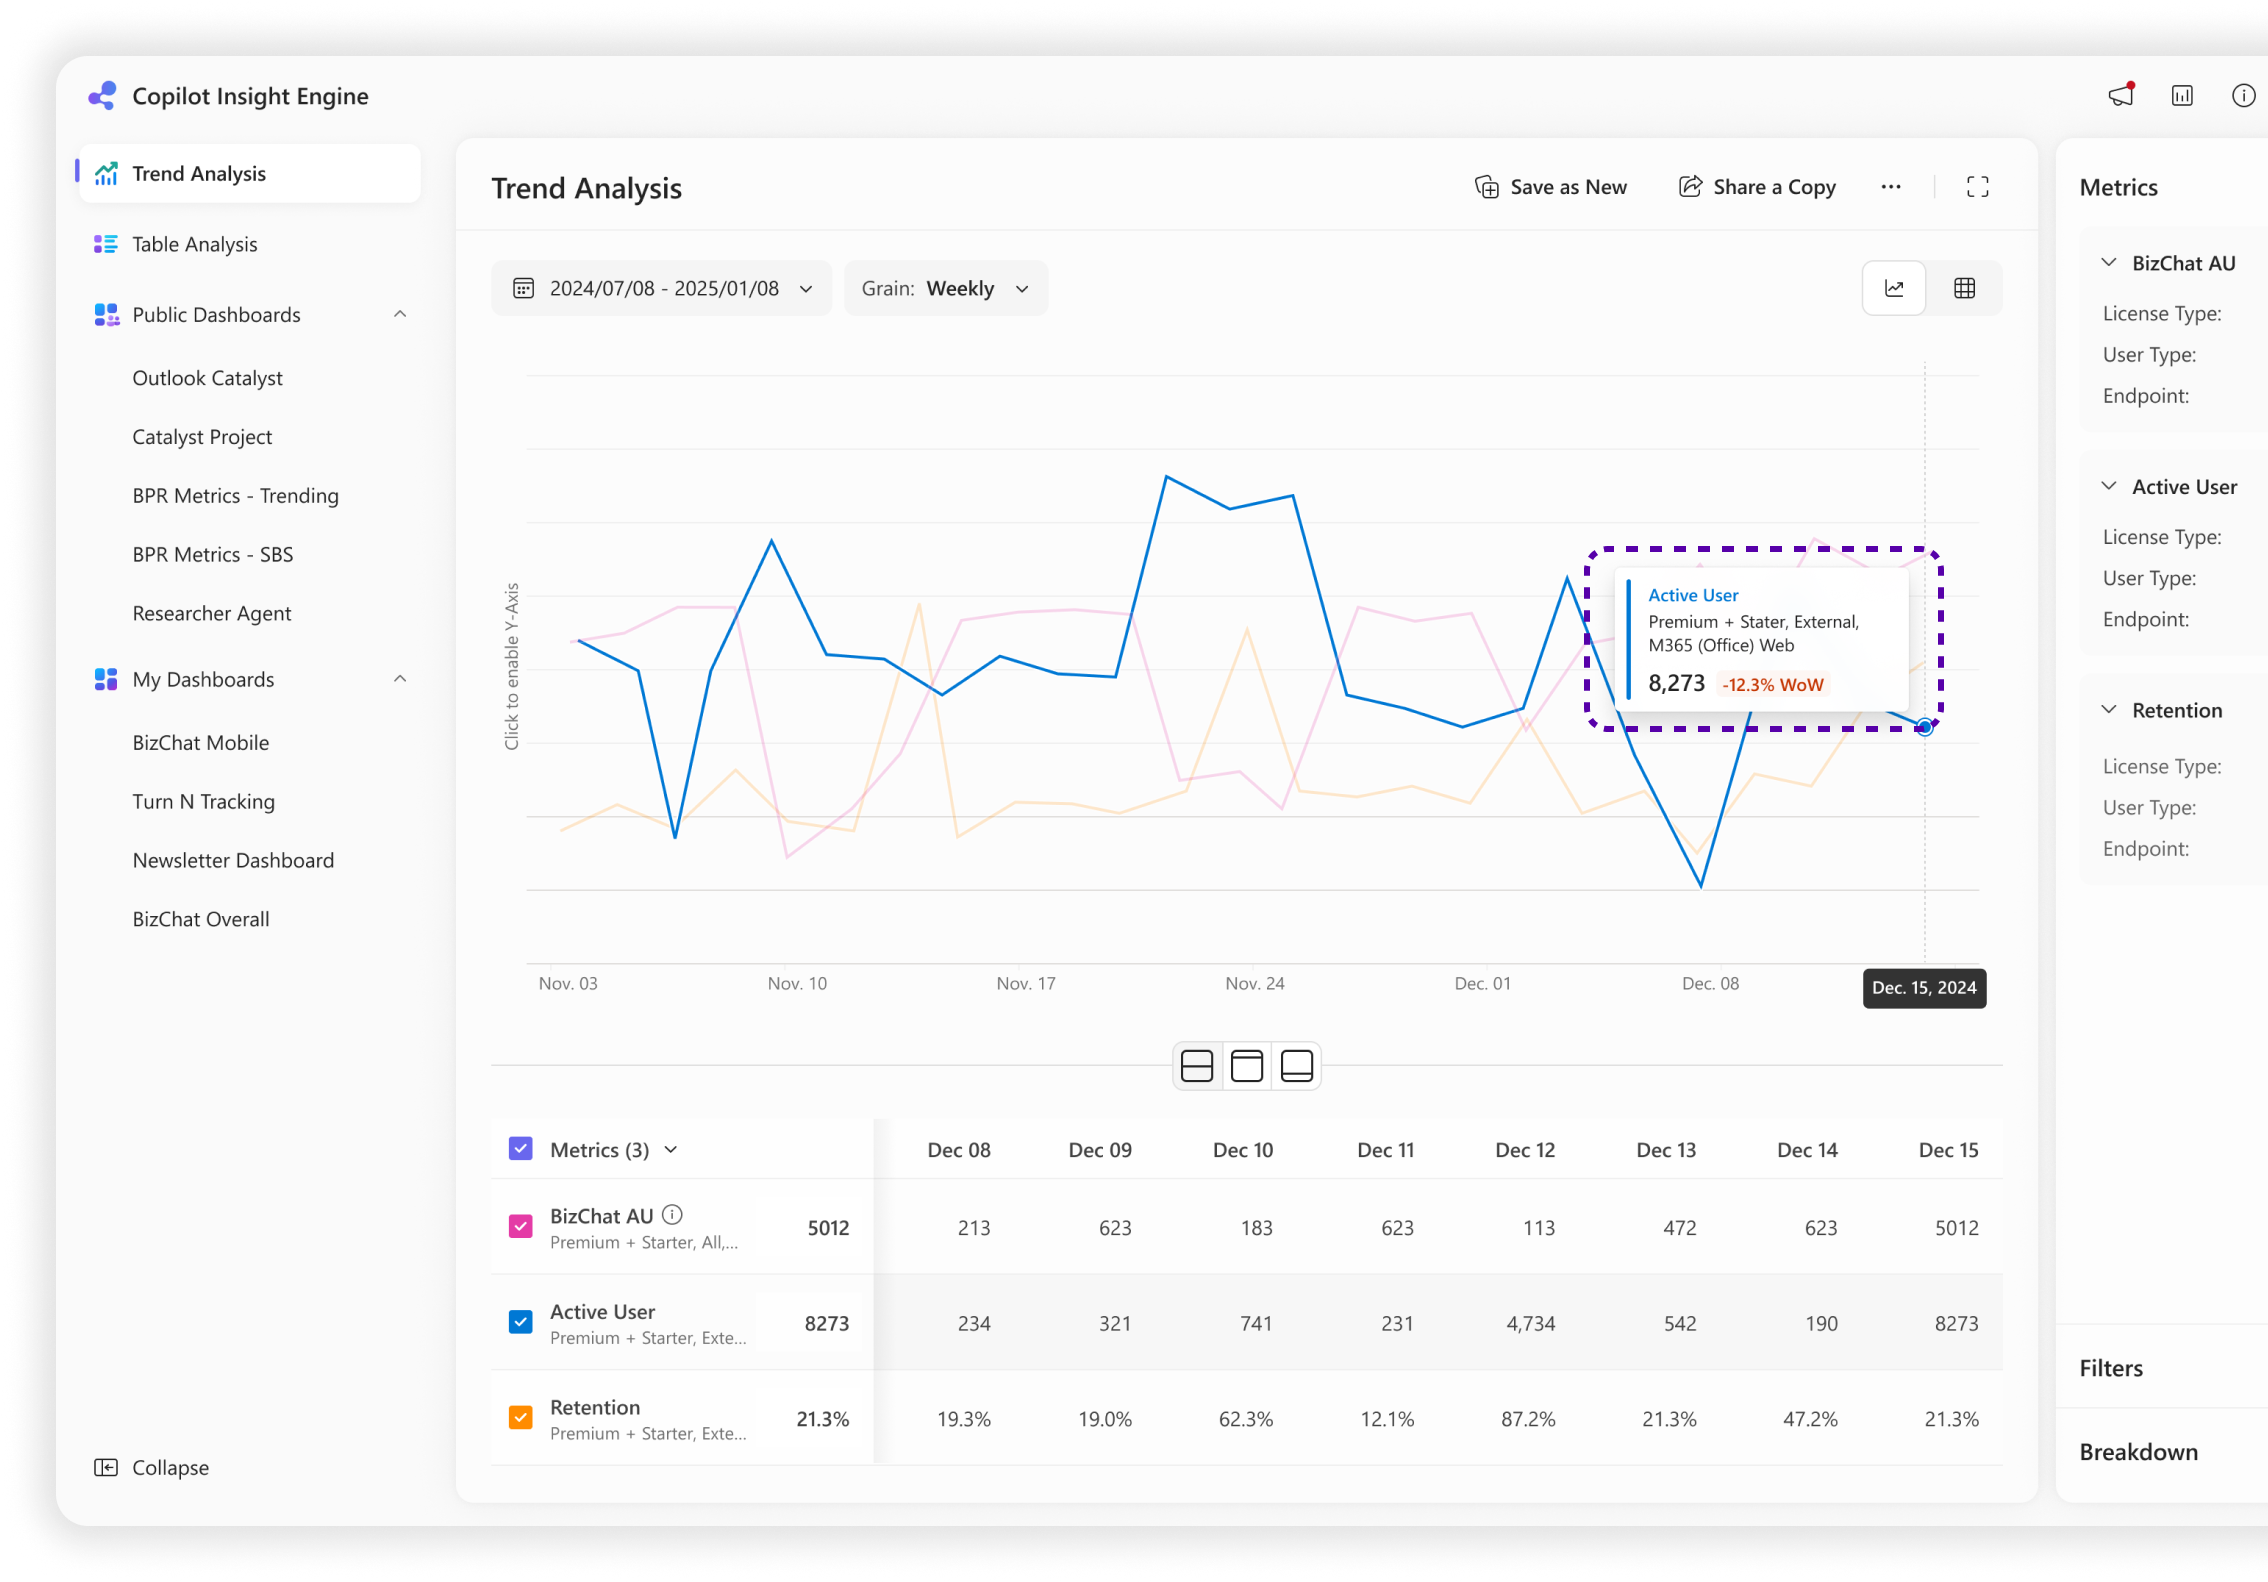
Revamped Metric Card
Provide complete metric configuration (slicer value) for better recognition and understanding. Highlight metric value and provide lightweight data comparison result.
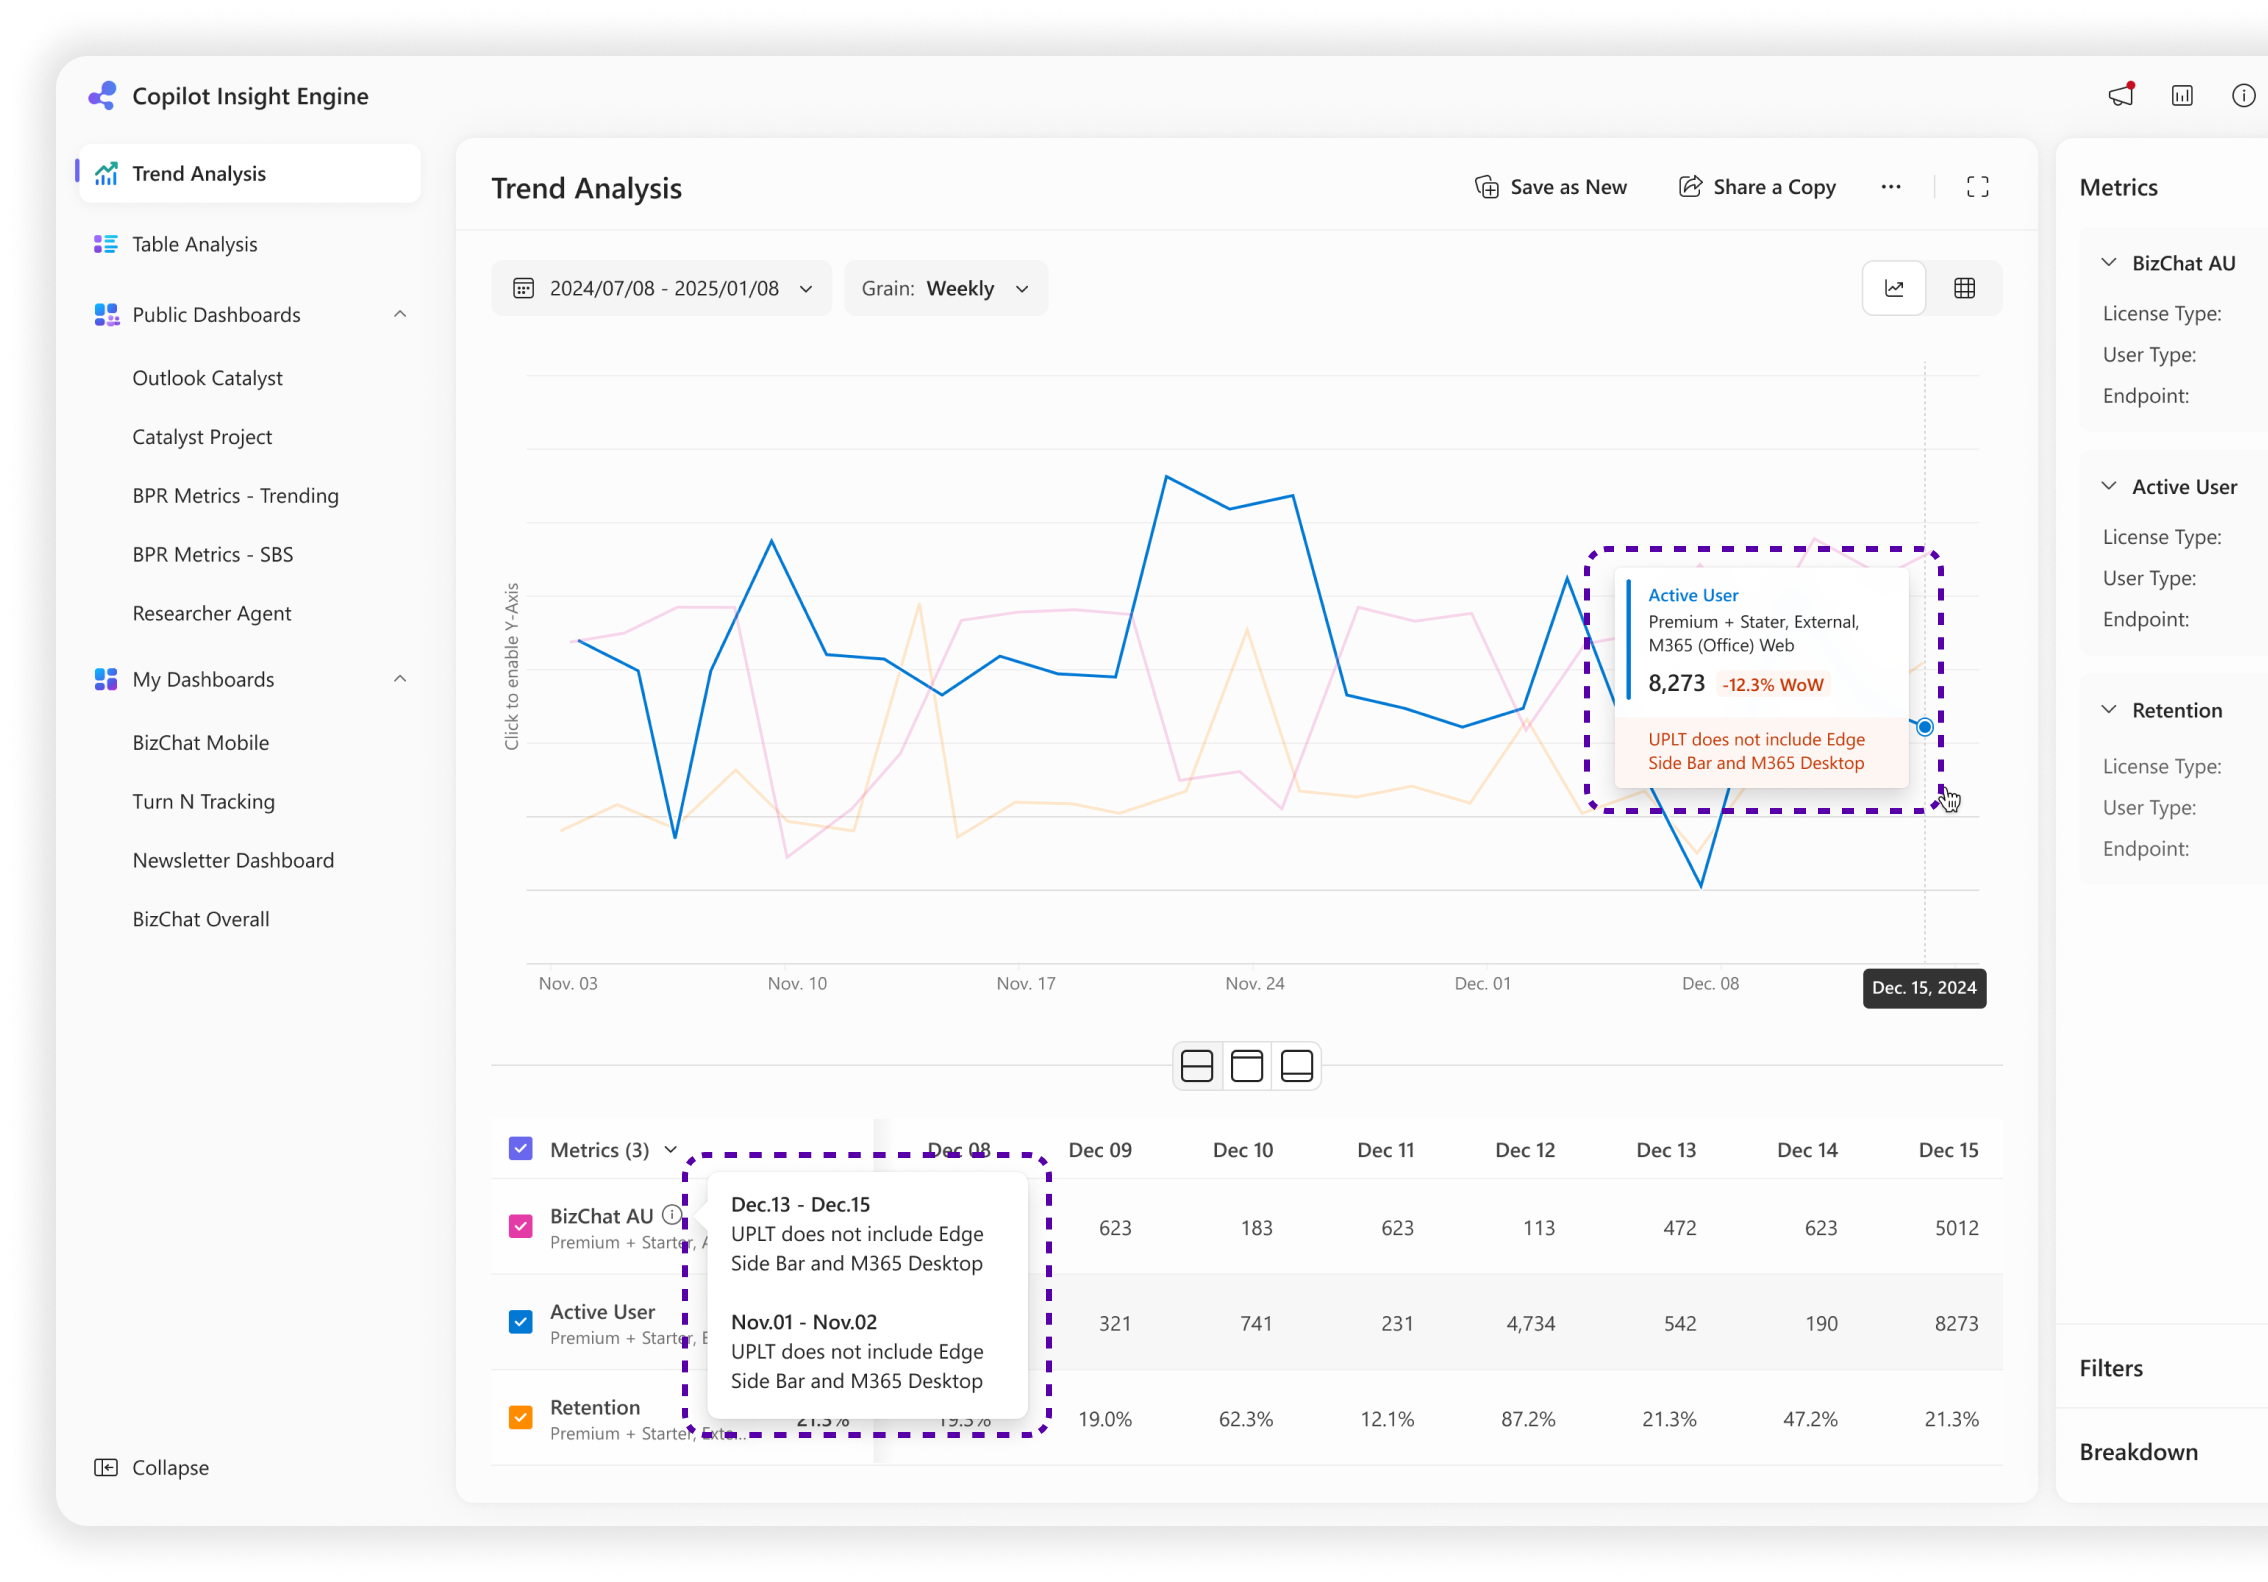
Data issue notice
Inform user whether the data they selected is correct and up to date. (validated or not)
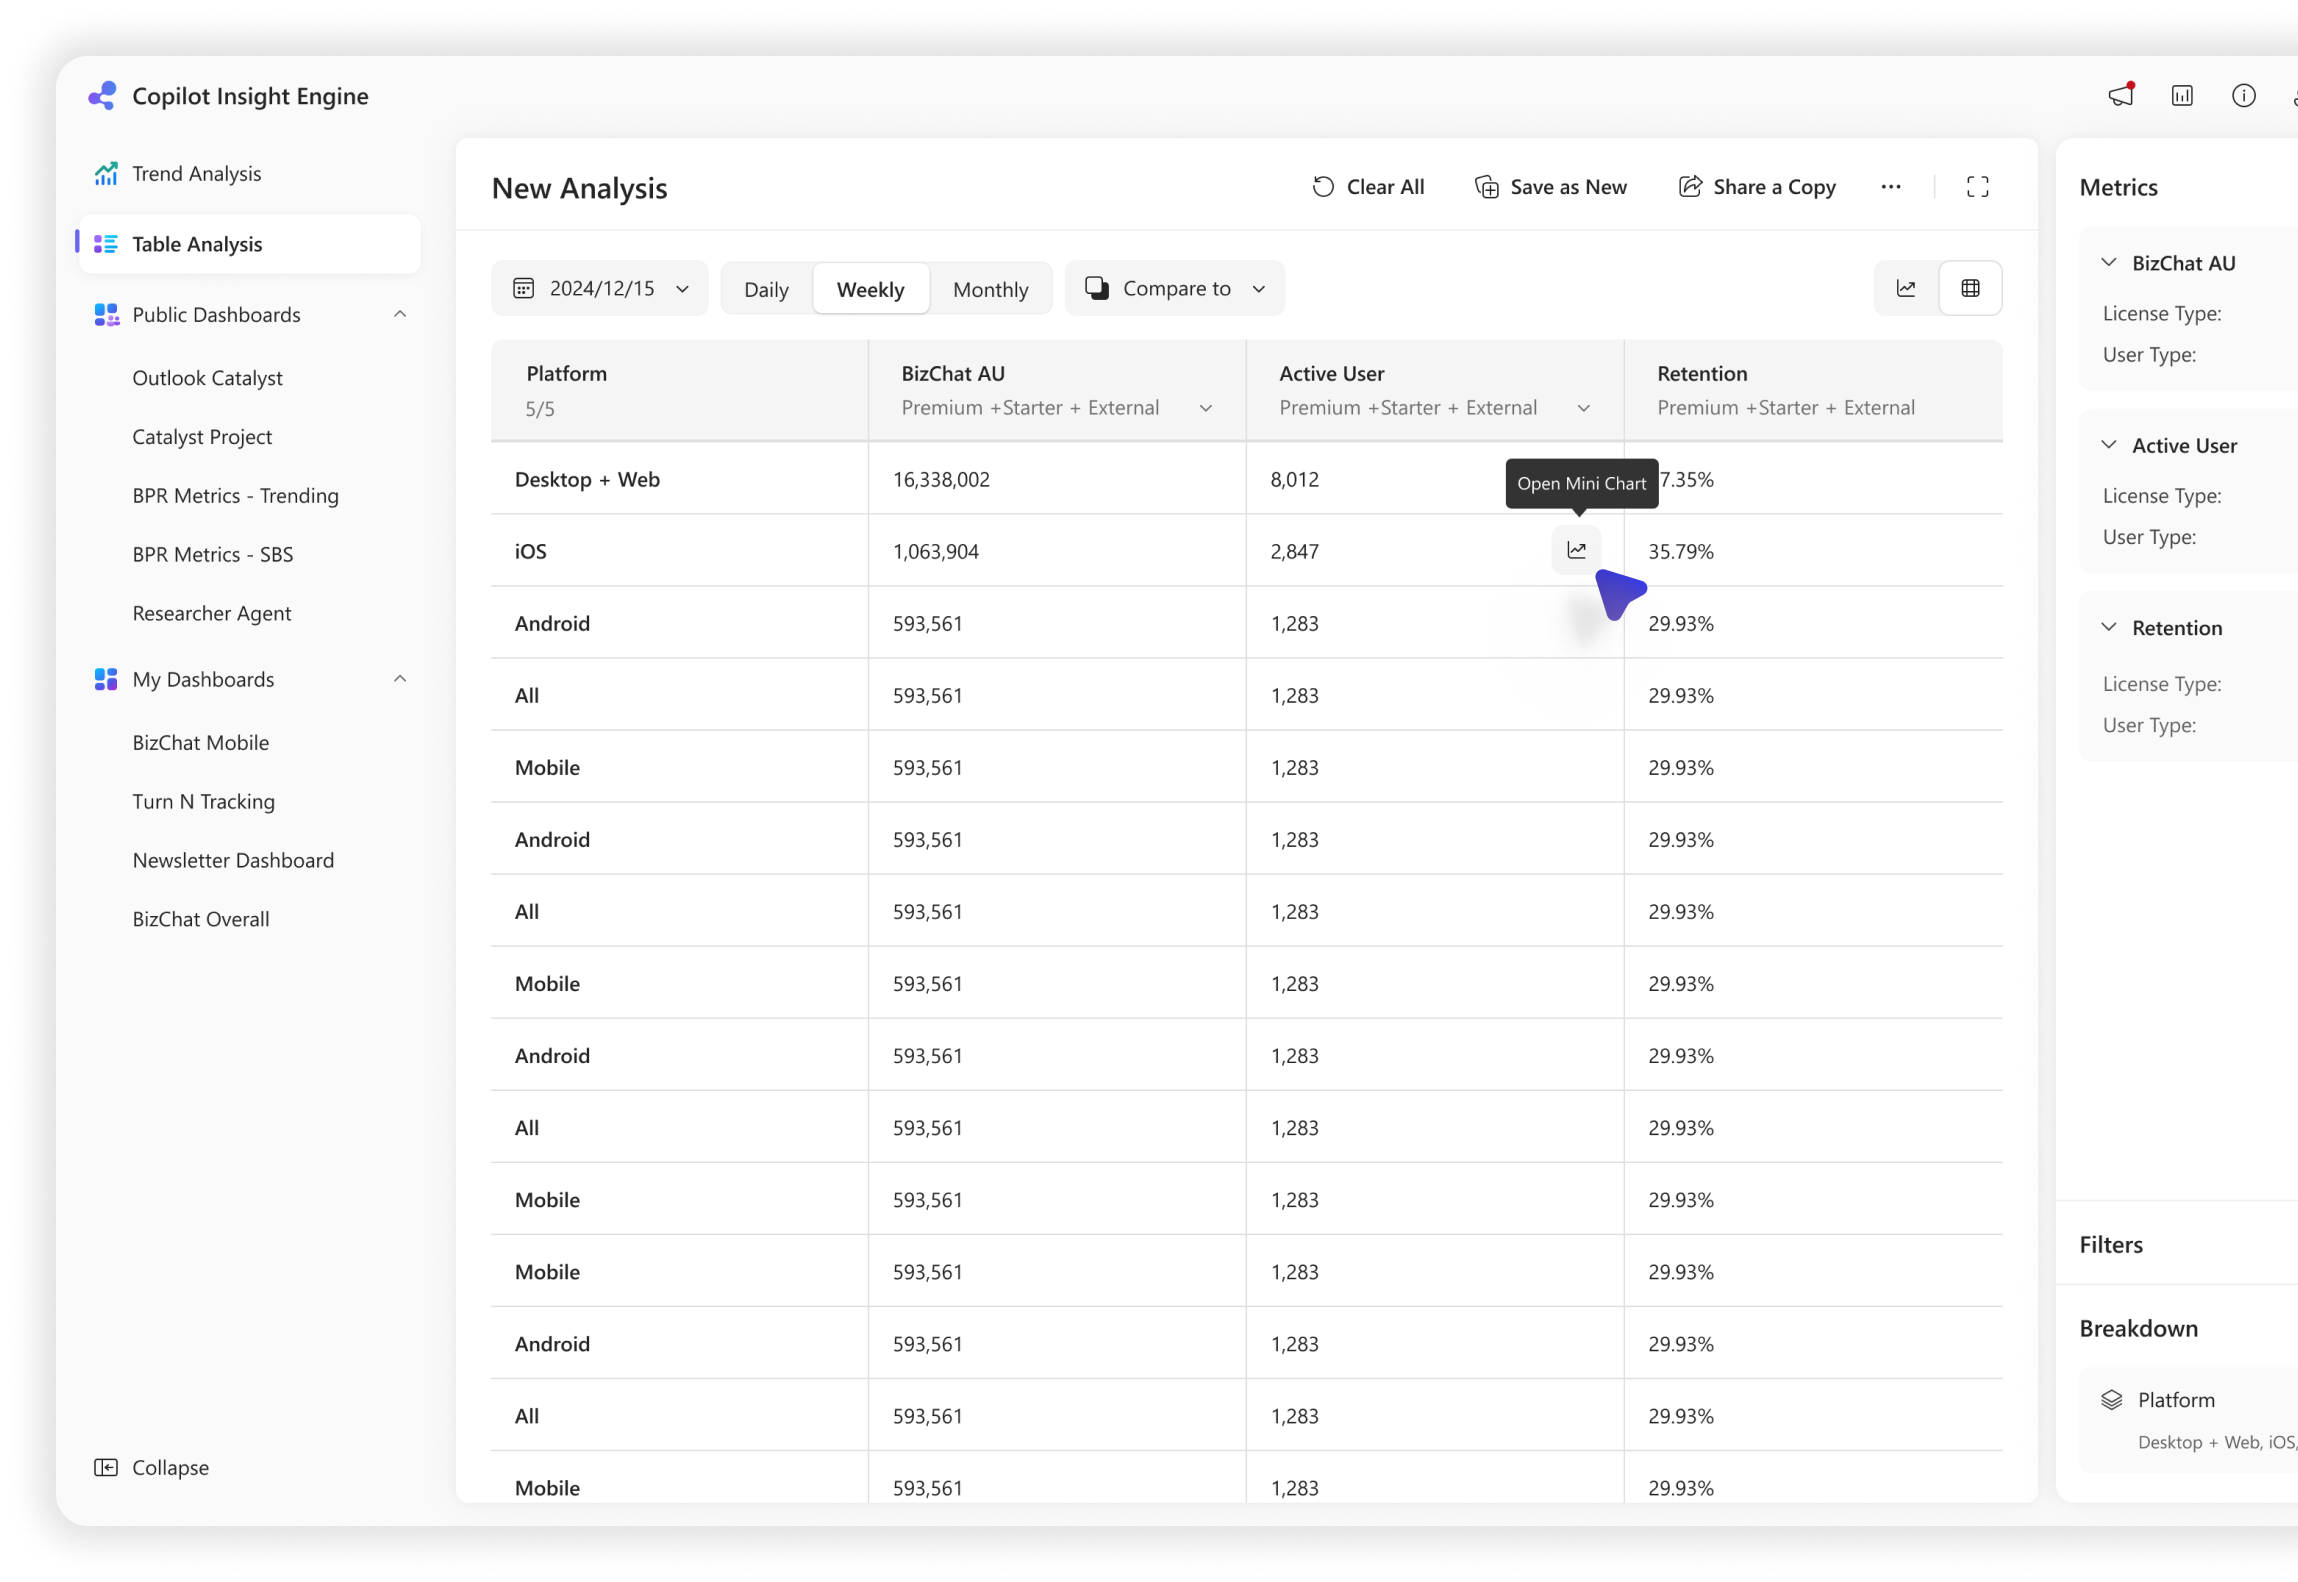
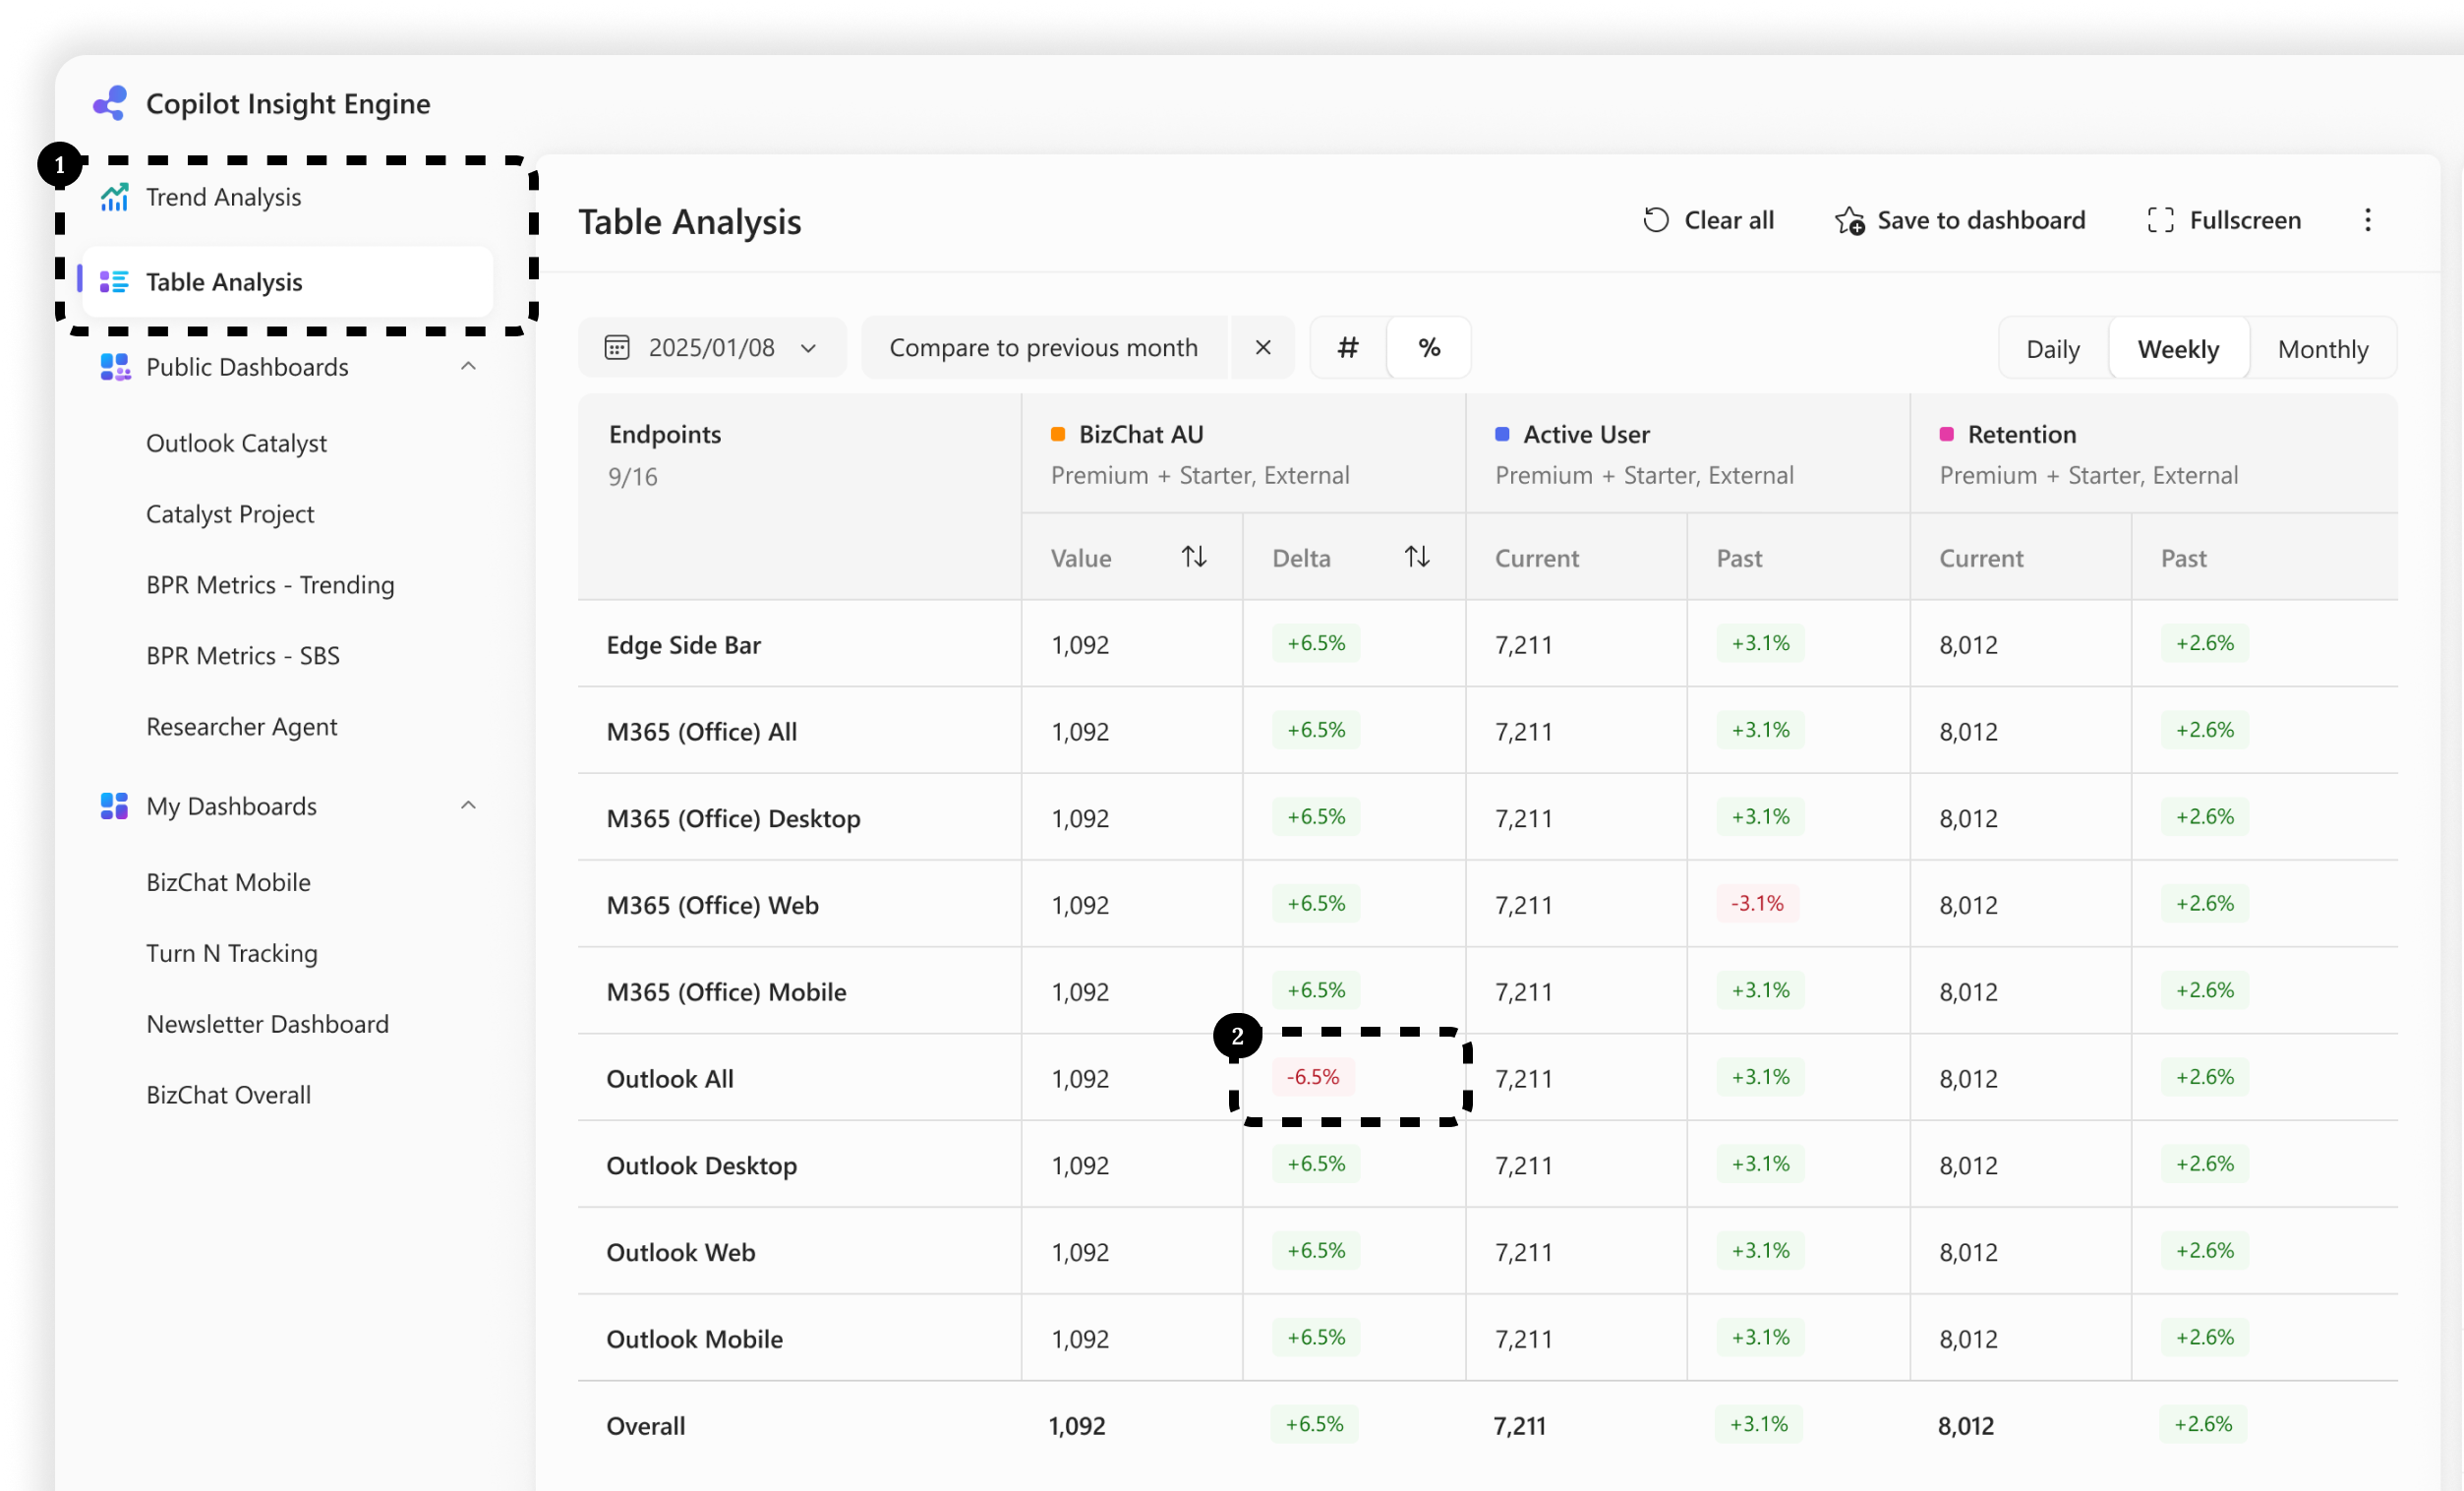
Solution — Scenario 2
Starting with a table chart, but wants a quick view the trend of specific data point over the past week to understand the drop/increase was sudden or gradual.
In-cell Trigger
Enable users to click on a cell in the table to trigger a mini trend view.
Mini Chart View
Check specific data point and view its trend over time, so I can understand anomalies or patterns.
Hover Card
Interaction-able metric card with complete information, value and delta, consistent UI with its under trend view.